Luxury cruise operator Viking (NYSE: VIK) reported Q2 CY2026 results topping the market’s revenue expectations, with sales up 16.5% year on year to $2.19 billion. Its non-GAAP profit of $1.31 per share was 5.4% above analysts’ consensus estimates.
Is now the time to buy Viking? Find out by accessing our full research report, it’s free.
Viking (VIK) Q2 CY2026 Highlights:
- Revenue: $2.19 billion vs analyst estimates of $2.15 billion (16.5% year-on-year growth, 2.1% beat)
- Adjusted EPS: $1.31 vs analyst estimates of $1.24 (5.4% beat)
- Adjusted EBITDA: $748.4 million vs analyst estimates of $718.3 million (34.2% margin, 4.2% beat)
- Operating Margin: 29.4%, in line with the same quarter last year
- Free Cash Flow was -$346.7 million compared to -$197.4 million in the same quarter last year
- Market Capitalization: $43.85 billion
Company Overview
From a single river cruise offering to a fleet of 96 vessels across multiple continents, Viking (NYSE: VIK) operates a fleet of small luxury cruise ships offering river, ocean, and expedition voyages focused on cultural enrichment and destination immersion.
Revenue Growth
A company’s top-line performance is one signal of its overall business quality. Strong growth can indicate it’s riding a successful new product or emerging trend. Viking’s annualized revenue growth rate of 18.9% over the last two years was weak for a consumer discretionary business.
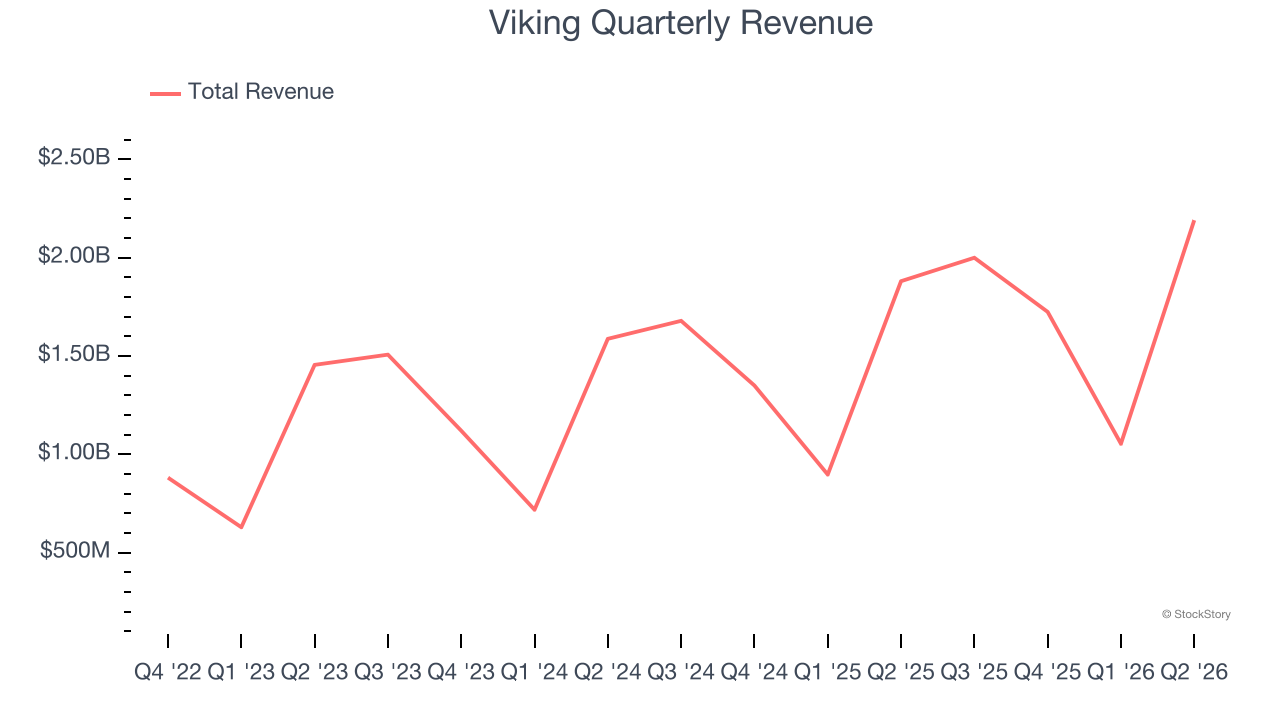
This quarter, Viking reported year-on-year revenue growth of 16.5%, and its $2.19 billion of revenue exceeded Wall Street’s estimates by 2.1%.
Looking ahead, sell-side analysts expect revenue to grow 16.4% over the next 12 months, a slight deceleration versus the last two years. Despite the slowdown, this projection is noteworthy and indicates the market is baking in success for its products and services.
ONE MORE THING: The $21 AI Application Stock Wall Street Forgot. While Wall Street obsesses over who’s building AI, one company is already using it to print money. And nobody’s paying attention.
AI chip stocks trade at ridiculous valuations. This company processes a trillion consumer signals monthly using AI and trades at a third of the price. The gap won’t last. The institutions will figure it out. You need to see this first. Read the FREE Report Before They Notice.
Operating Margin
Operating margin is a key measure of profitability. Think of it as net income - the bottom line - excluding the impact of taxes and interest on debt, which are less connected to business fundamentals.
Viking’s operating margin has risen over the last 12 months and averaged 22.5% over the last two years. The company’s higher efficiency is a breath of fresh air, but its suboptimal cost structure means it still sports lousy profitability for a consumer discretionary business.
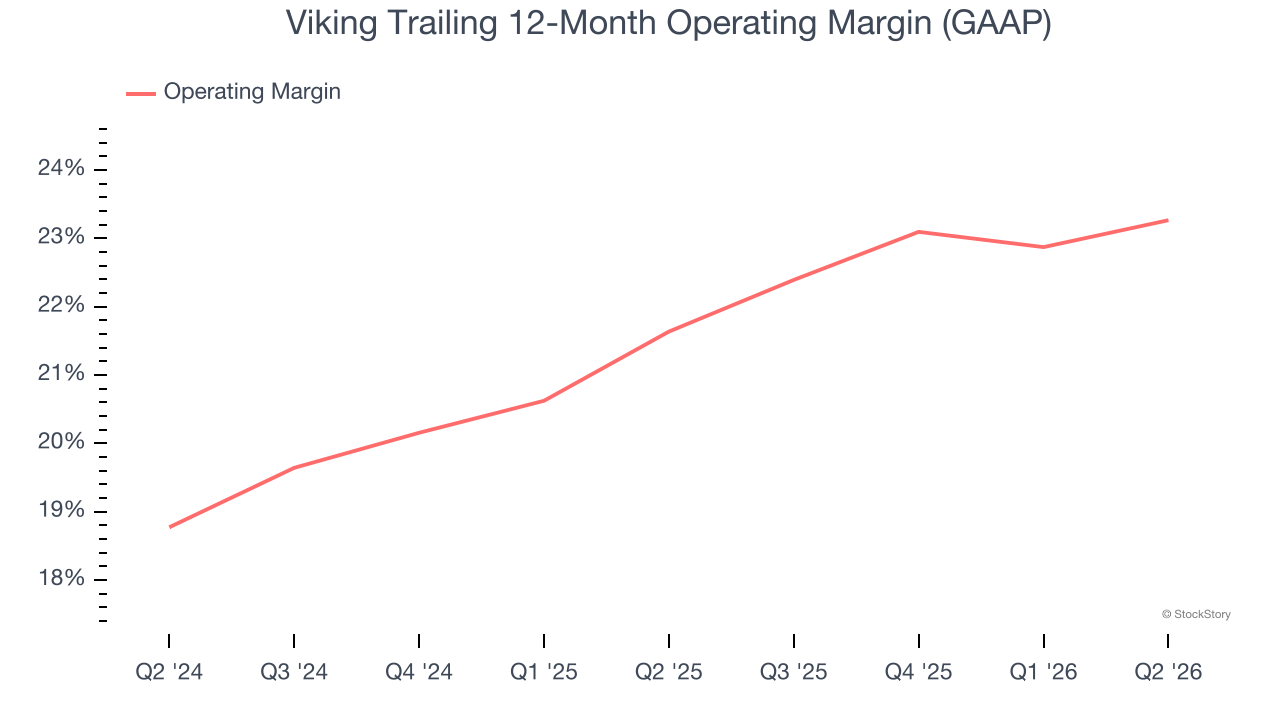
This quarter, Viking generated an operating margin profit margin of 29.4%, in line with the same quarter last year. This indicates the company’s overall cost structure has been relatively stable.
Cash Is King
Free cash flow isn’t a prominently featured metric in company financials and earnings releases, but we think it’s telling because it accounts for all operating and capital expenses, making it tough to manipulate. Cash is king.
Viking has shown poor cash profitability relative to peers over the last two years, giving the company fewer opportunities to return capital to shareholders. Its free cash flow margin averaged 15.1%, below what we’d expect for a consumer discretionary business.
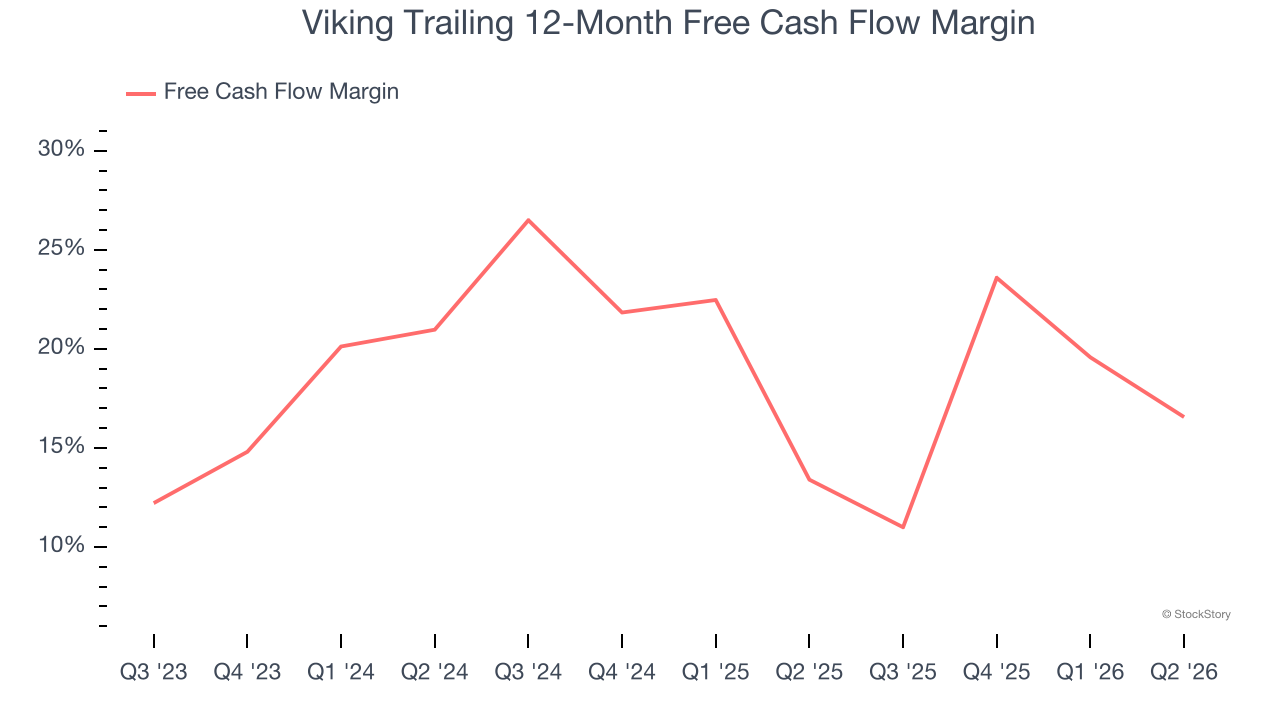
Viking burned through $346.7 million of cash in Q2, equivalent to a negative 15.8% margin. The company’s cash burn increased from $197.4 million of lost cash in the same quarter last year. These numbers deviate from its longer-term margin, indicating it is a seasonal business that must build up inventory during certain quarters.
Over the next year, analysts predict Viking’s cash conversion will improve. Their consensus estimates imply its free cash flow margin of 16.6% for the last 12 months will increase to 35.2%, giving it more flexibility for investments, share buybacks, and dividends.
Key Takeaways from Viking’s Q2 Results
It was encouraging to see Viking beat analysts’ revenue expectations this quarter. We were also glad its EPS outperformed Wall Street’s estimates. Overall, this print had some key positives. The stock remained flat at $98.75 immediately after reporting.
Viking had an encouraging quarter, but one earnings result doesn’t necessarily make the stock a buy. Let’s see if this is a good investment. If you’re making that decision, you should consider the bigger picture of valuation, business qualities, as well as the latest earnings. We cover that in our actionable full research report which you can read here (it’s free).