As we head into 2026, amid buzz about potential changes in Venezuelan oil flows following recent political shifts, many are wondering whether this could shake up natural gas prices here at home. The short answer? Probably not much, at least not directly. Sure, both oil and natural gas are key players in the energy world. Still, they dance to pretty different tunes—oil markets are tied more to global crude supply, refining, and gasoline demand. In contrast, natural gas prices hinge on factors such as weather-driven heating demand, LNG exports, pipeline flows, and domestic production from regions like the Marcellus and Permian basins. Any influx of Venezuelan heavy crude might tweak oil dynamics a bit down the line, but experts largely agree the impacts on natural gas will be minimal or indirect at best.
While the recent political upheaval in Venezuela has opened the door to potential increases in its heavy crude output—currently hovering around 1 million barrels per day, or less than 1% of global supply—experts remain skeptical about any meaningful ripple effects on natural gas markets in 2026. Even optimistic forecasts suggest production might climb gradually to 1.3-1.4 million bpd over the next couple of years, but that's still a drop in the ocean amid a projected global oil (and LNG) surplus driven by ramp-ups elsewhere. Below, we break down the key reasons the disconnect persists, from subtle regional shifts to longstanding infrastructure hurdles to the fundamentally different drivers shaping oil and gas prices.
1. Indirect Regional Substitution
- Reduced LNG Demand: Increased oil and gas production in Venezuela could allow the country to resume natural gas exports to neighbors like Colombia via existing pipelines. This would reduce those countries' reliance on Liquified Natural Gas (LNG) imports, potentially easing some demand in the global LNG market.
- Refining Competition: Venezuelan heavy crude is a direct competitor to similar grades from Mexico and Canada. If U.S. refineries shift back to processing cheaper Venezuelan crude, it could subtly alter the energy cost structures for large-scale industrial users, but this rarely trickles down to residential natural gas rates.
2. Disconnect Between Oil and Natural Gas Prices
- Low Correlation: Financial analysts note there is very little direct correlation between price changes for crude oil and natural gas. Natural gas prices are more heavily influenced by domestic production (such as the U.S. Permian Basin), seasonal weather patterns, and local storage levels.
- Surplus in 2026: Even without Venezuela, the 2026 global market is already facing a surplus of both oil and LNG due to expanding production elsewhere, which currently exerts more downward pressure on prices than the situation in Venezuela.
3. Barriers to Impact
- Infrastructure Delays: Experts emphasize that Venezuela's energy infrastructure is so damaged that it will take years and billions of dollars in investment before production levels rise enough to move global market needles.
- Limited Market Share: As of early 2026, Venezuela accounted for less than 1% of global oil production. Even if production doubled, it would still represent only a small fraction of global supply, limiting its ability to "shock" broader energy prices (including natural gas).
In a space where prices can spike or crater on a single cold snap, this relative stability means fewer wild swings, giving traders more predictable conditions to build positions, hedge risks, and avoid getting caught in additional unexpected volatility.
Technical Picture
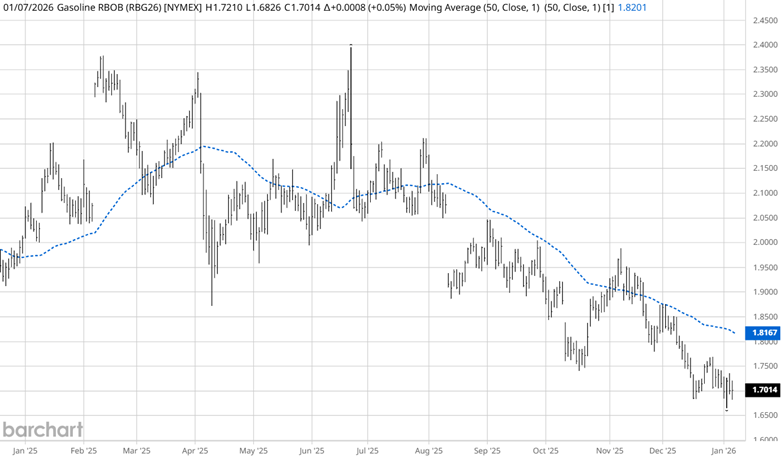
Source: Barchart
Looking at the last year of trading, the natural gas daily nearby chart shows volatility from January 2025 to about August 2025. The market traded in a broad sideways range, unable to find a trend on either side of the 50-day moving average (SMA). Since August of 2025, the market has respected the downtrend in the 50-day SMA. The Venezuelan news discussed above should allow the downtrend to continue without significant fundamental shocks from the region.
Barchart Monthly Seasonal Pattern
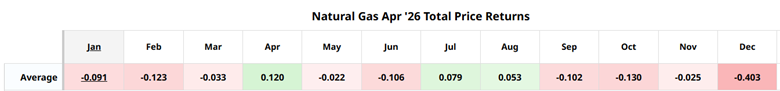
Source: Barchart (monthly seasonal patterns)
Barchart research over the past 15 years has found that January is typically a down month, losing approximately 0.091 ticks. In the U.S., natural gas storage involves two main seasons: injection (April-October), when natural gas is injected underground when demand is low, and withdrawal (November-March), when cold weather drives high demand, and gas is withdrawn. By the time January rolls around, underground storage is typically at or near its seasonal high (often topping out in late fall), providing a massive buffer of readily available gas—hundreds of billions of cubic feet—that producers and pipelines can draw from quickly to meet surging heating needs without scrambling for every last molecule from current production. This abundant, low-cost supply source helps cap upside price pressure during the heart of winter. In contrast, if storage entered the season low (due to a hot summer or prior disruptions), even normal cold weather could drive sharper rallies as the market worries about running short by March.
Seasonal Pattern
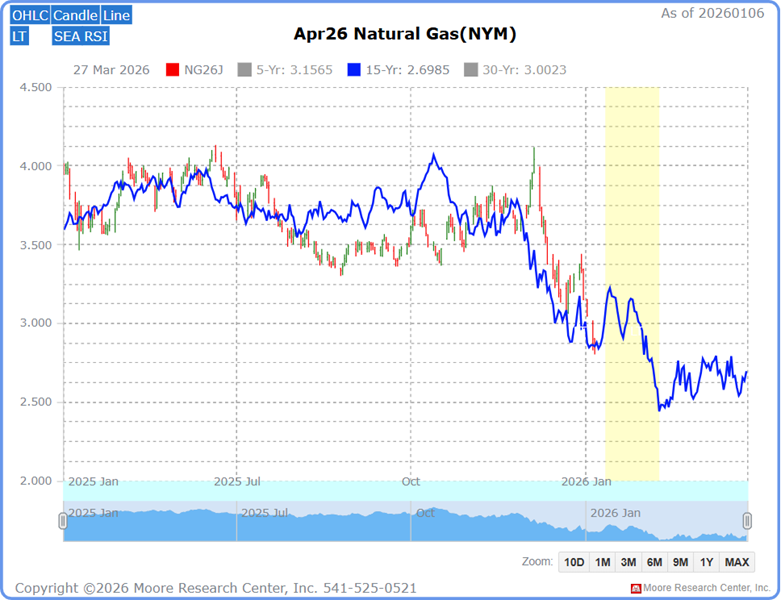
Source: Moore Research Center, Inc. (MRCI)
Since January 2025, the natural gas April futures contract has been following its 15-year seasonal pattern (blue) reasonably well. With the recent price sell-off, the market may need a relief rally find some more supply to push prices lower. MRCI research has refined an optimal seasonal window (yellow box) for that to happen. The seasonal pattern reveals that, as natural gas enters this optimal window, it tends to spike higher. Allowing traders to sell at higher prices before the seasonal decline arrives. MRCI's optimal seasonal sell window for the April natural gas futures contract shows that the market has closed lower on February 09 than on January 12 in 13 of the past 15 years, an 87% occurrence. During this hypothetical testing period, the average profit per contract was 0.206 tics or $2,056.67.
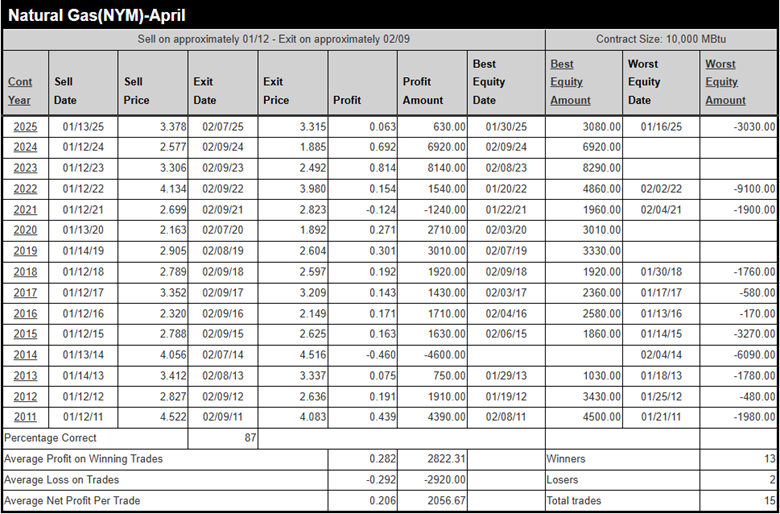
Source: MRCI
During these 15 years, four did not have a daily closing drawdown, and these occurred during the recent 7 years.
As a crucial reminder, while seasonal patterns can provide valuable insights, they should not be the basis for trading decisions. Traders must consider various technical and fundamental indicators, risk management strategies, and market conditions to make informed and balanced trading decisions.
Assets to Trade in the Natural Gas Market
For futures traders:
NG is the standard-size contract.
QG is the mini-size contract.
CN is the micro-sized contract.
For equity traders:
An exchange-traded fund (ETF) symbol UNG. Be aware that UNG does not consistently track returns on futures. The ideal time to trade UNG is when the natural gas market is in backwardation.
Options traders:
Puts & Calls are available for all of the natural gas contracts.
In Closing…
All told, as we kick off 2026 with fresh political winds blowing through Venezuela, the bottom line for natural gas traders is pretty reassuring: any extra heavy crude trickling out of Caracas—maybe pushing production toward 1.3 or 1.4 million barrels a day in the coming years—won't deliver much of a jolt to nat gas prices. The two commodities don't move in lockstep, thanks to separate drivers such as weather, domestic shale output, storage levels, and a looming global LNG surplus that's already keeping a lid on prices. Venezuela's battered infrastructure and tiny market share mean real supply shocks are years away, if ever. That lack of drama helps tame volatility in a market famous for wild swings. At the same time, charts show the downtrend holding steady and seasonal patterns pointing to the usual January softness—bolstered by those fat late-fall storage builds that cushion winter demand. For anyone trading NG futures, the minis, micros, UNG shares, or options, the message is clear: keep an eye on the weather and technicals as always, but don't lose sleep over headlines from Venezuela. The fundamentals here at home still call the shots.
On the date of publication, Don Dawson did not have (either directly or indirectly) positions in any of the securities mentioned in this article. All information and data in this article is solely for informational purposes. For more information please view the Barchart Disclosure Policy here.
More news from Barchart


