The meteoric rise of the Roundhill Memory ETF (DRAM) has become the definitive “poster child” for the 2026 AI infrastructure boom. Launched on April 2, the fund has shattered industry records, reaching $6.5 billion in assets under management (AUM) in under six weeks. That’s a pace faster than the historic launches of spot Bitcoin ETFs earlier in the decade.
However, for those with a sense of market history (raising my hand as I type with the other one), the current vertical ascent is beginning to look less like a structural shift and more like the final, parabolic phase of the 1999-2000 Nasdaq Index ($NASX) bubble.
The rally in DRAM, and its primary holdings like Micron (MU), SK Hynix, and Samsung, is built on the concept of the “Memory Wall.” As AI models grow in complexity, the bottleneck has shifted from raw compute power (GPUs) to memory bandwidth. This has triggered a massive prepayment cycle, where big tech hyperscalers are effectively subsidizing the memory giants’ capital expenditures to secure supply through 2027.
This provides a floor for contract prices. Simultaneously, however, a dangerous divergence has emerged. Long-term contract prices for AI-grade High-Bandwidth Memory (HBM) are skyrocketing, but consumer spot prices for traditional PCs and smartphones are falling off a cliff.
The DRAM ETF is exceptionally top heavy, with three stocks representing about 70% of the fund’s total weight. It owns fewer than 15 stocks in total.
1999 Parallels: Hype vs. Reality
The technical and psychological extremes in the memory sector are currently flashing the same top signals seen during the 2000 tech peak. I was there, and I’ve seen this before. I just can’t say for sure when it ends. I do feel comfortable saying it is a “when” and not an “if.”
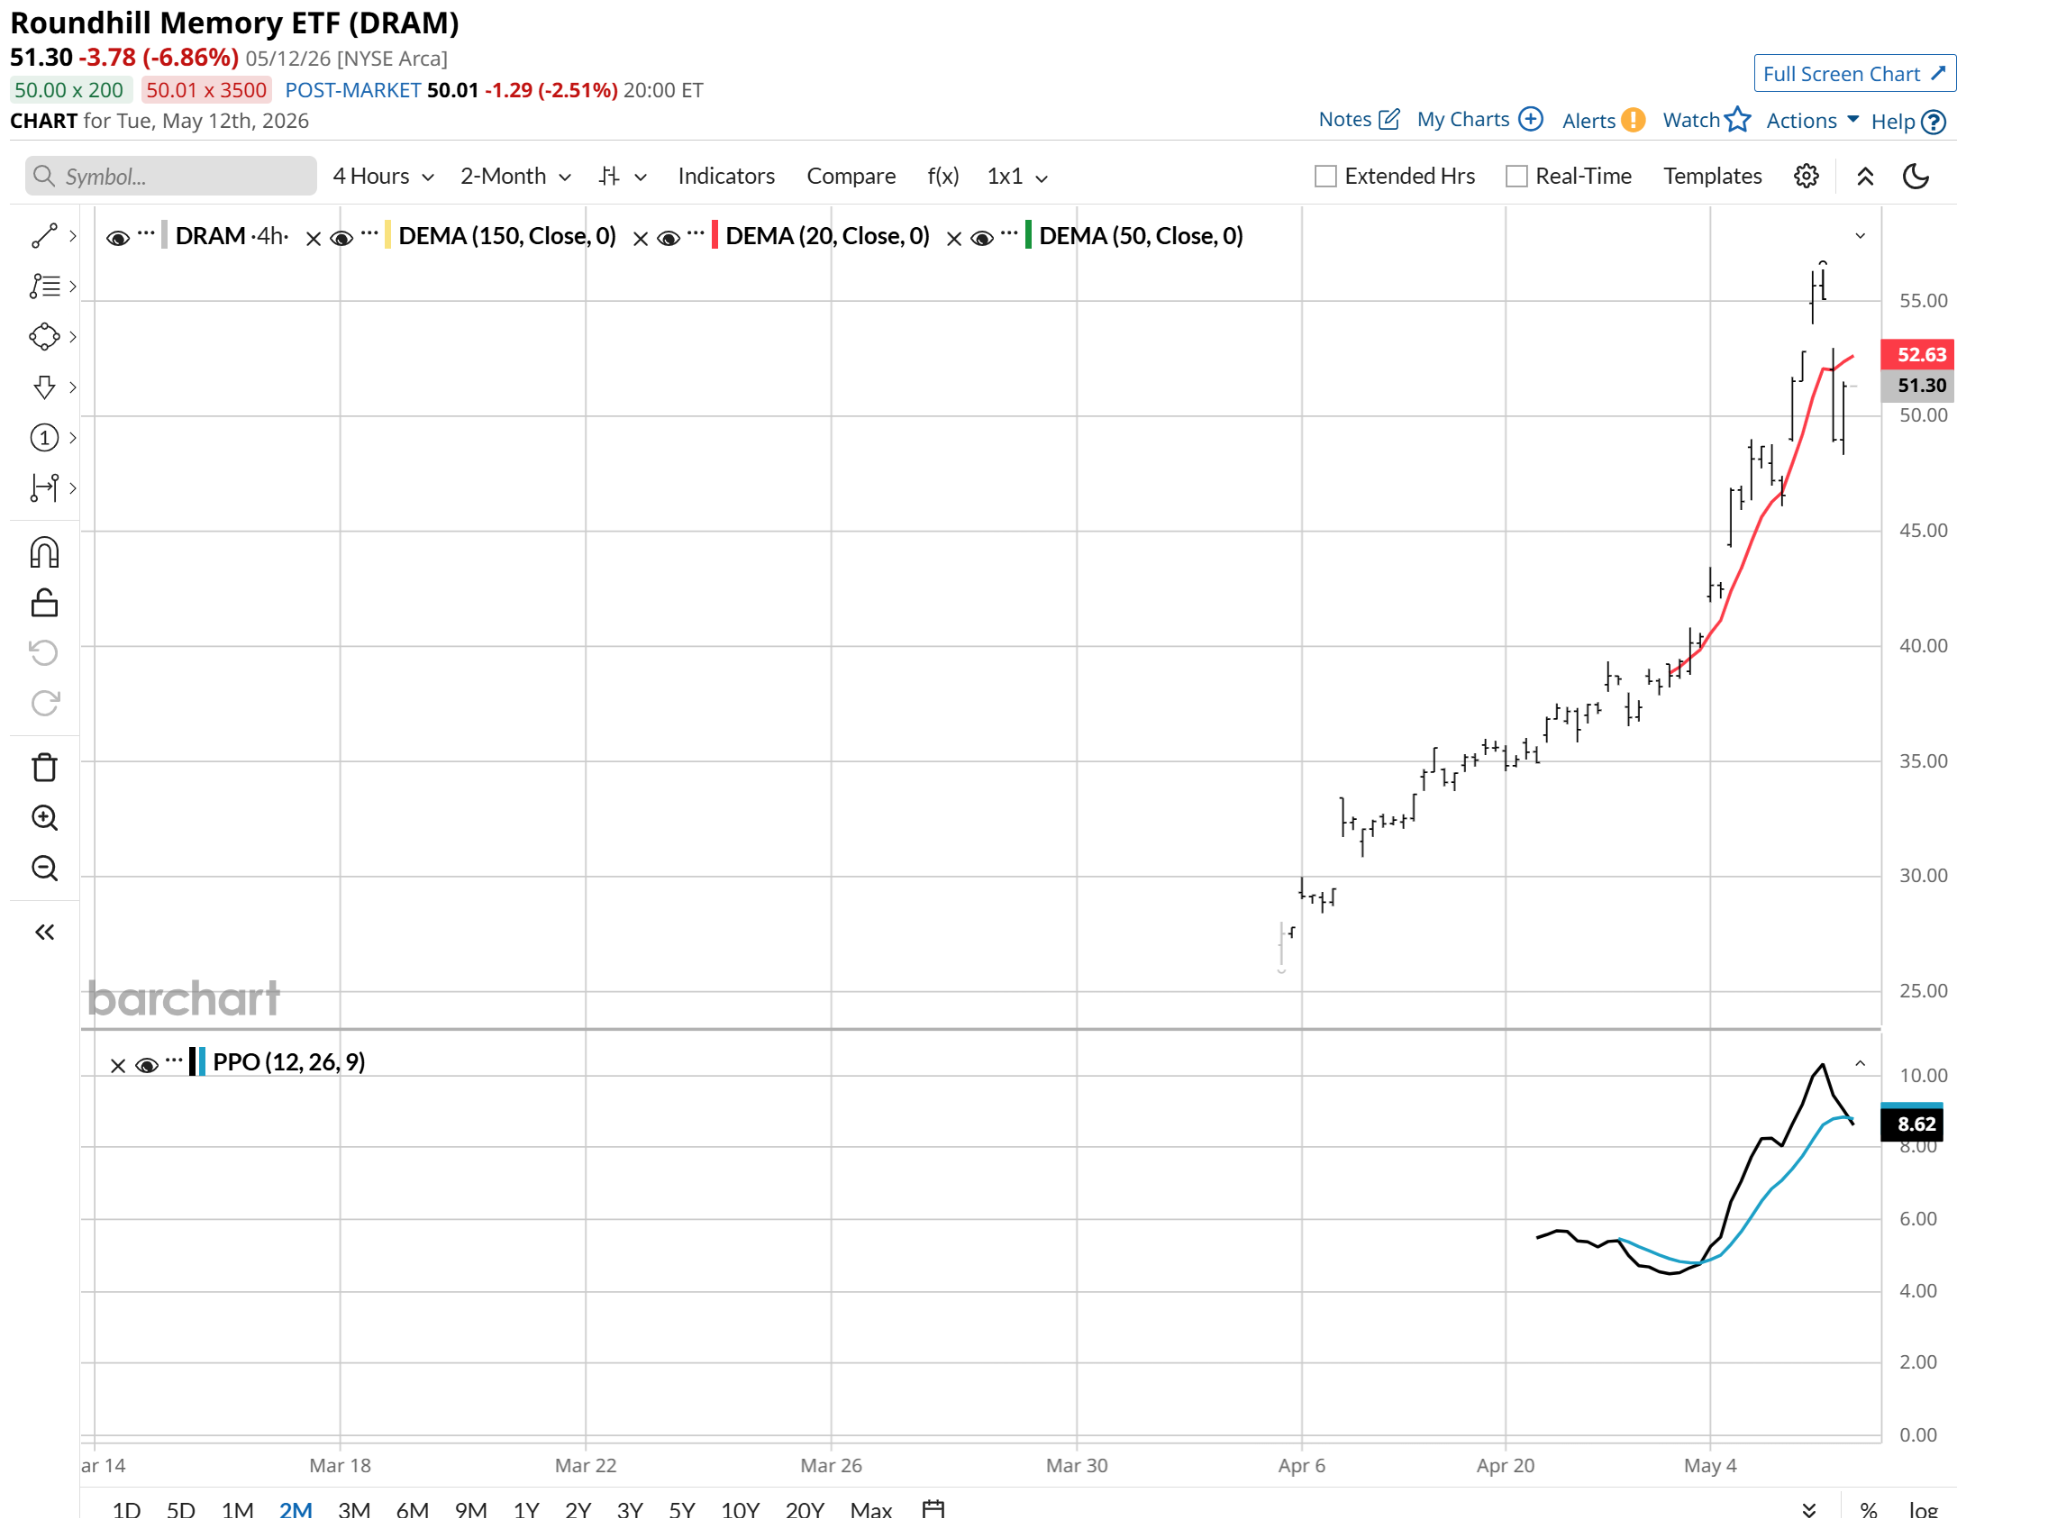
Here’s a 4-hour price chart for DRAM. It has only been listed for a matter of weeks, so I’m showing this to indicate just how sharp a move we’ve seen.
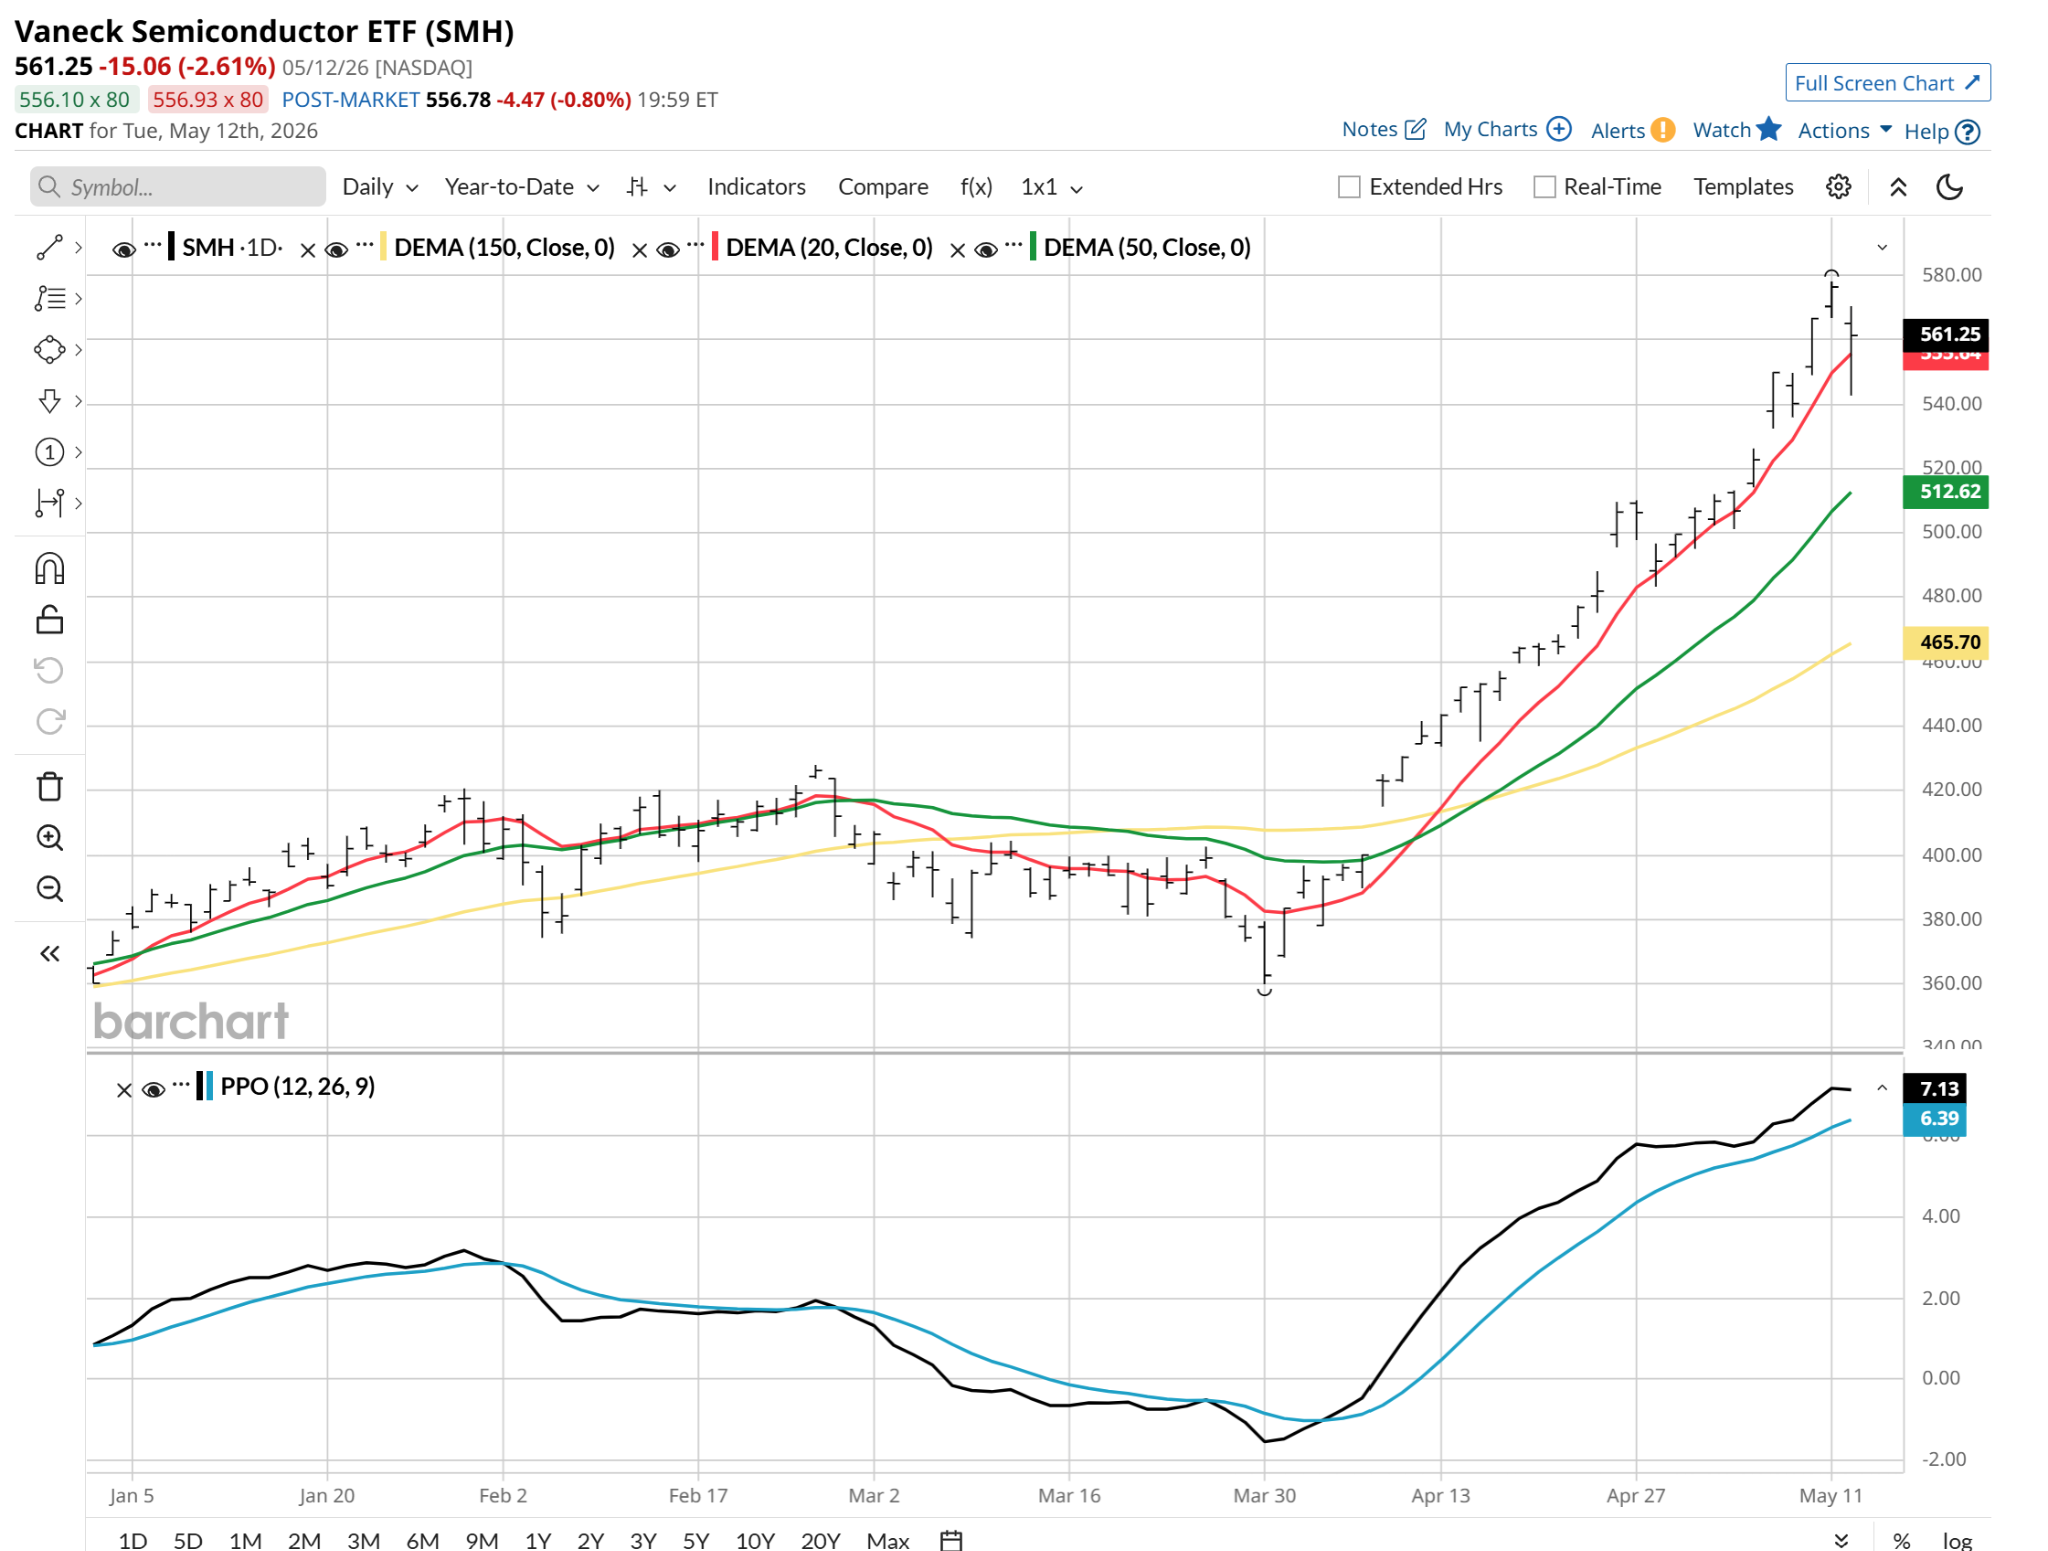
Semiconductor stocks are currently trading above their 200-day moving averages by the largest margin since the dot-com burst. Here’s what the VanEck Semiconductor ETF (SMH), one of the legacy ETFs in that sector, looks like:
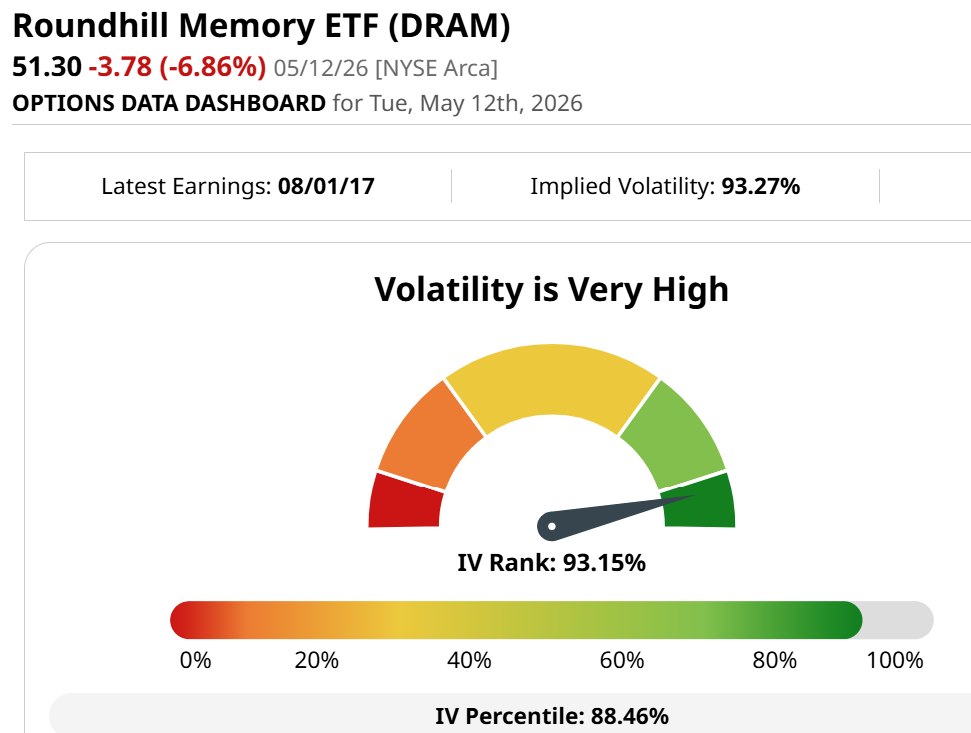
While the broader IT industry trades at a multiple of roughly 27x, many momentum-driven AI names are reaching triple-digit forward earnings ratios, leaving zero margin for error. DRAM’s surge has been accompanied by record call option volume. That’s a classic sign of retail chasing a trend that typically precedes a selloff led by institutional investors.
RAMmageddon Risk?
The primary threat to this latest AI supercycle is a sudden collapse in the supply-demand imbalance. If Big Tech’s capital expenditure slows, or if the anticipated ROI from AI fails to materialize, the current supply deficit could rapidly transform into a supply glut.
The higher the mountain, the more treacherous the backside. Thus, investors should be wary of treating a cyclical peak like this one as a permanent plateau.
Rob Isbitts created the ROAR Score, based on his 40+ years of technical analysis experience. ROAR helps DIY investors manage risk and create their own portfolios. For Rob’s written research, check out ETFYourself.com.
On the date of publication, Rob Isbitts did not have (either directly or indirectly) positions in any of the securities mentioned in this article. All information and data in this article is solely for informational purposes. For more information please view the Barchart Disclosure Policy here.
More news from Barchart
- Super Micro Computer Just Promoted a New Chief Business Officer as It Aims for a Turnaround
- Ahead of Intuitive Machines Earnings, Here Is What Barchart Options Data Shows for LUNR Stock
- GF Securities Reckons Qualcomm Will Be a Hit in the CPU Server Cycle. QCOM Stock Has a Rocky Road Ahead.
- MSFT Stock Alert: What to Know as LinkedIn Plans 2026 Layoffs


