The S&P 500 index faced a harsh reality check on March 5, 2026, as it decisively failed to breach the 6,900 resistance level, tumbling into negative territory for the year. This reversal marks a significant shift in market sentiment, erasing the modest gains of early 2026 and signaling the potential end of the AI-driven euphoria that dominated the previous year. As the index closed near 6,820, investors are grappling with a "triple threat" of sticky inflation, a hawkish Federal Reserve, and a sudden geopolitical flare-up in the Middle East that has sent energy prices soaring.
The immediate implications of this technical rejection are profound. For months, the 6,900 level acted as a formidable "ceiling," reinforced by heavy options positioning and the 50-day Simple Moving Average (SMA). By failing to hold this line, the index has triggered a wave of automated selling, dragging the broader market down and forcing a re-evaluation of growth valuations. Volatility has surged back into the marketplace, with the CBOE Volatility Index (INDEXCBOE: VIX) jumping to 22.08, its highest reading since the autumn of 2025, suggesting that the era of "low-volatility climbing" may be over for the foreseeable future.
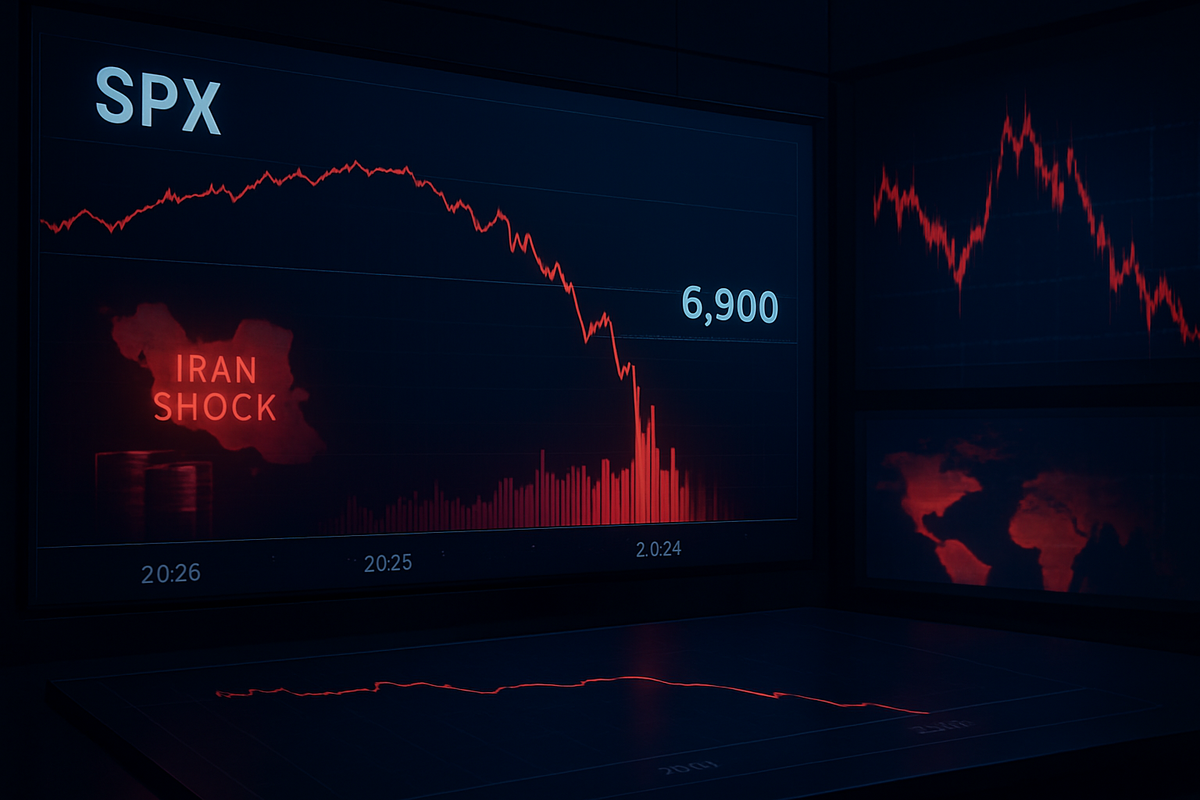
The Technical Breakdown and the "Iran Shock"
The path to 6,900 was paved with optimism in January 2026, when the index briefly touched an all-time high of 7,002. However, throughout February, the momentum began to stall as technical indicators signaled an overbought market. Traders identified 6,900 as a critical "Point of Control"—a level where high volumes of call options were concentrated, creating a gamma wall that effectively capped upside potential. On March 5, 2026, this wall became a trampoline for the bears, as the S&P 500 fell approximately 0.8%, decisively cracking the 100-day moving average at 6,835, which had served as a reliable support floor for nearly four months.
The primary catalyst for the session’s sharp decline was a sudden geopolitical shock. Reports emerged of an Iranian missile strike on a commercial tanker in the Persian Gulf, causing WTI Crude Oil prices to spike above $84 per barrel. This event instantly reignited fears of a second wave of energy-led inflation, complicating the Federal Reserve's path forward. Earlier in the day, market participants were already on edge following a Core CPI report that showed inflation remaining stubborn between 2.5% and 3.1%, far above the Fed's 2% target.
Timeline-wise, the market's descent began in the pre-market session as news of the tanker strike broke. By midday, a broad-based liquidation was underway as the "higher-for-longer" interest rate narrative returned with a vengeance. Fed officials, who had previously teased further rate cuts in 2026, have now pivoted to a data-dependent pause, with many analysts forecasting that no rate relief will arrive until at least June. This shift in policy expectations has stripped the market of the liquidity cushion that many had relied upon to justify record-high valuations.
Winners and Losers in a Volatile Landscape
The shift from growth to defensive posturing has created a stark divide among public companies. The most notable losers have been the "Magnificent Seven" and other tech titans that fueled the 2025 rally. Microsoft (NASDAQ: MSFT) has become the primary drag on the index, with its shares down over 17% year-to-date as investors question the immediate return on investment for its multi-billion-dollar AI infrastructure. Similarly, NVIDIA (NASDAQ: NVDA) saw its momentum fracture, falling 5% as the market reached "AI trade" saturation. Tesla (NASDAQ: TSLA) also faced heavy selling, dropping 11% YTD amidst a broader slowdown in consumer discretionary spending and rising manufacturing costs linked to energy prices.
On the industrial side, companies like Caterpillar (NYSE: CAT) and GE Aerospace (NYSE: GE) saw significant intraday losses, with the Dow Jones Industrial Average tumbling over 800 points. These firms are particularly sensitive to supply chain disruptions and rising fuel costs, making them early victims of the renewed Middle Eastern tensions. The panic was not limited to equities; the bond market saw a sell-off in long-dated Treasuries as yields rose in anticipation of prolonged high interest rates, further squeezing growth-oriented tech stocks.
Conversely, defensive and value-oriented stocks have emerged as relative winners. Walmart (NYSE: WMT) has seen its stock rise 14% year-to-date, acting as a "safe haven" for investors seeking stability and essential consumer exposure. Berkshire Hathaway (NYSE: BRK.B) has also outperformed, benefiting from its massive cash pile and diversified insurance holdings which tend to weather inflationary periods better than pure-play tech. Energy giants, while facing broader market volatility, have seen renewed interest as oil prices trend upward, providing a hedge against the geopolitical risks now dominating the headlines.
Wider Significance and Historical Precedents
The failure at 6,900 is more than just a technical glitch; it represents a fundamental transition in the market cycle. Throughout 2025, the "AI gold rush" allowed investors to overlook traditional valuation metrics and sticky inflation data. However, the events of early March 2026 suggest that the "stagflation" narrative—slow growth combined with persistent inflation—is returning to the forefront. This shift mirrors the market behavior seen in the late 1970s and early 2020s, where geopolitical shocks provided the final push for a market already teetering on overvaluation.
Industry-wide, we are witnessing a rotation out of "momentum" and into "quality." This trend has significant ripple effects on venture capital and private equity, as the cooling public markets make IPOs less attractive and force startups to focus on profitability over growth. Furthermore, the regulatory environment is tightening. With the Fed forced to maintain high rates to combat energy-driven inflation, there is increased pressure on the banking sector, particularly regional banks that may still carry legacy low-interest debt on their books.
Historical comparisons are also being drawn to the "dot-com" correction of 2000, where a highly concentrated market hit a ceiling once the initial hype regarding a new technology (in this case, AI) met the reality of earnings reports. While the current environment is backed by more robust earnings than the 2000 era, the concentration of the S&P 500 in a handful of tech stocks has made the entire index vulnerable to a "reversion to the mean." The breakdown of the 6,900 resistance suggests that the "mean" may be significantly lower than where the market currently sits.
What Comes Next: Scenarios and Strategic Pivots
In the short term, the S&P 500 is searching for a new floor. Technical analysts are closely watching the 6,730 level, which represents the February low. If this level fails to hold, the index is likely to target the 200-day SMA, currently hovering between 6,570 and 6,590. A drop to that range would officially put the index into a "correction" phase, defined as a 10% decline from its January peak. This scenario would likely necessitate a further shift into defensive assets, such as short-term Treasury bills and gold, which has historically performed well during periods of geopolitical instability.
Long-term, the market’s trajectory will depend almost entirely on two factors: the duration of the energy price spike and the Fed's willingness to "look through" supply-side inflation. If oil prices stabilize quickly, the 6,900 level could be retested by early summer. However, if the conflict in the Middle East escalates or spreads, the "inflation floor" will rise, potentially forcing the Fed to keep rates at current levels through the end of 2026. This would require a strategic pivot from institutional investors, moving away from high-beta growth stocks toward high-dividend yielders and "hard assets."
Market participants should also watch for a potential "earnings recession" in the upcoming Q1 2026 reports. If the mega-cap tech companies cannot prove that their AI investments are translating into tangible bottom-line growth, the liquidation of the "Magnificent Seven" could accelerate. This would create a challenging environment for passive index investors, but could provide significant opportunities for active managers who can navigate the volatility and identify undervalued sectors that have been ignored during the AI frenzy.
Market Wrap-Up and Investor Outlook
The S&P 500's retreat from 6,900 on March 5, 2026, serves as a stark reminder that markets do not move in a straight line forever. The combination of a technical ceiling, a geopolitical "black swan" event, and a pivot in Federal Reserve expectations has effectively ended the honeymoon period of early 2026. Investors have transitioned from a state of "Fear Of Missing Out" (FOMO) to a state of capital preservation, as evidenced by the surge in the VIX and the rotation into defensive staples like Walmart and Berkshire Hathaway.
Moving forward, the market is likely to remain in a high-volatility regime. The "erased gains" of 2026 suggest that the path of least resistance is currently downward until a solid support level is established. For investors, the coming months will require a disciplined approach. Watching the $80–$85 range for WTI Crude and the 6,730 support level for the S&P 500 will be crucial in determining whether this is a minor pullback or the start of a more prolonged downturn.
In summary, the 6,900 level has proved to be a bridge too far for a market burdened by high expectations and external shocks. While the long-term prospects for the U.S. economy remain tied to technological innovation, the immediate future belongs to those who can manage risk and navigate a world where "higher-for-longer" is no longer a threat, but a reality.
This content is intended for informational purposes only and is not financial advice