
Electrical construction and infrastructure services provider MYR Group (NASDAQ: MYRG) fell short of the market’s revenue expectations in Q4 CY2024, with sales falling 17.4% year on year to $829.8 million. Its GAAP profit of $0.99 per share was 59% above analysts’ consensus estimates.
Is now the time to buy MYR Group? Find out by accessing our full research report, it’s free.
MYR Group (MYRG) Q4 CY2024 Highlights:
- Revenue: $829.8 million vs analyst estimates of $888.5 million (17.4% year-on-year decline, 6.6% miss)
- EPS (GAAP): $0.99 vs analyst estimates of $0.62 (59% beat)
- Adjusted EBITDA: $45.49 million vs analyst estimates of $34.25 million (5.5% margin, 32.8% beat)
- Operating Margin: 3.6%, in line with the same quarter last year
- Free Cash Flow Margin: 1.1%, down from 2.2% in the same quarter last year
- Backlog: $2.58 billion at quarter end, up 2.7% year on year
- Market Capitalization: $1.96 billion
Management CommentsRick Swartz, MYR’s President and CEO, said, “We finished 2024 with our fourth quarter performance showing overall improvement compared to the third quarter. A steady backlog of $2.58 billion reflects a healthy bidding environment and the continued investment in infrastructure to meet growing electrification demands across the U.S. and Canada.”
Company Overview
Constructing electrical and phone lines in the American Midwest dating back to the 1890s, MYR Group (NASDAQ: MYRG) is a specialty contractor in the electrical construction industry.
Construction and Maintenance Services
Construction and maintenance services companies not only boast technical know-how in specialized areas but also may hold special licenses and permits. Those who work in more regulated areas can enjoy more predictable revenue streams - for example, fire escapes need to be inspected every five years–. More recently, services to address energy efficiency and labor availability are also creating incremental demand. But like the broader industrials sector, construction and maintenance services companies are at the whim of economic cycles as external factors like interest rates can greatly impact the new construction that drives incremental demand for these companies’ offerings.
Sales Growth
A company’s long-term sales performance is one signal of its overall quality. Even a bad business can shine for one or two quarters, but a top-tier one grows for years. Thankfully, MYR Group’s 10.2% annualized revenue growth over the last five years was solid. Its growth beat the average industrials company and shows its offerings resonate with customers.
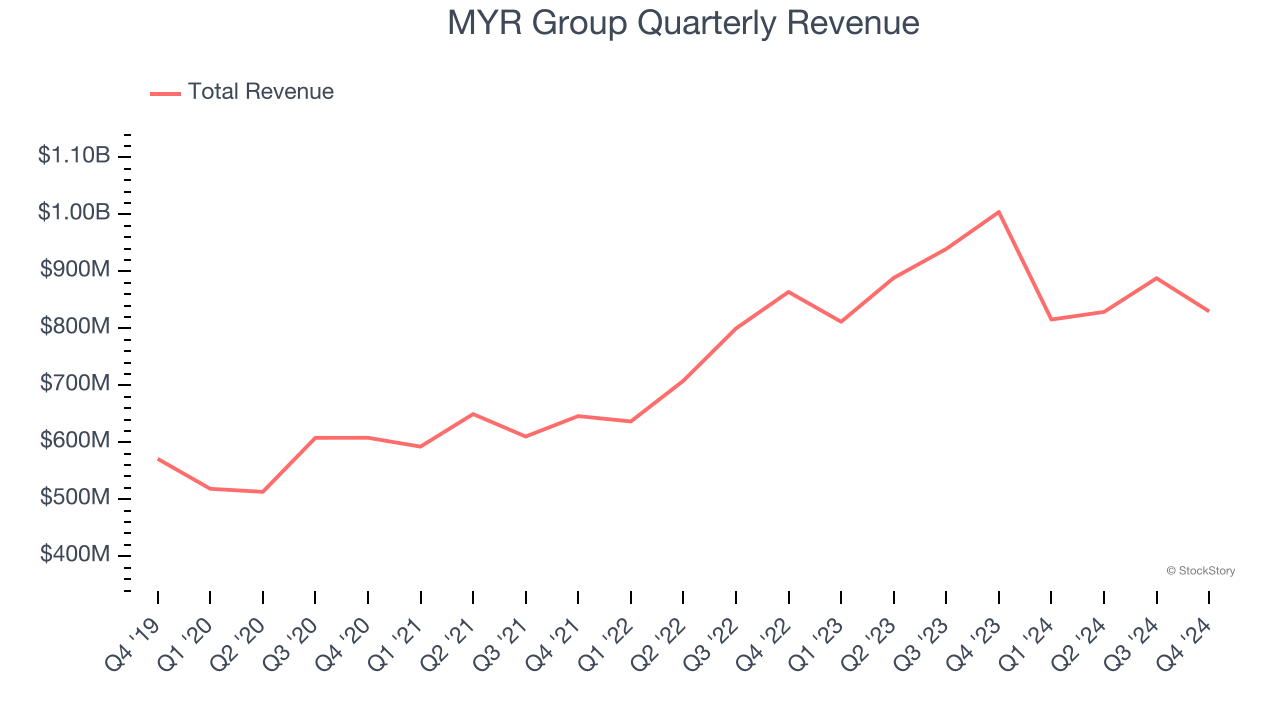
Long-term growth is the most important, but within industrials, a half-decade historical view may miss new industry trends or demand cycles. MYR Group’s recent history shows its demand slowed as its annualized revenue growth of 5.7% over the last two years is below its five-year trend. 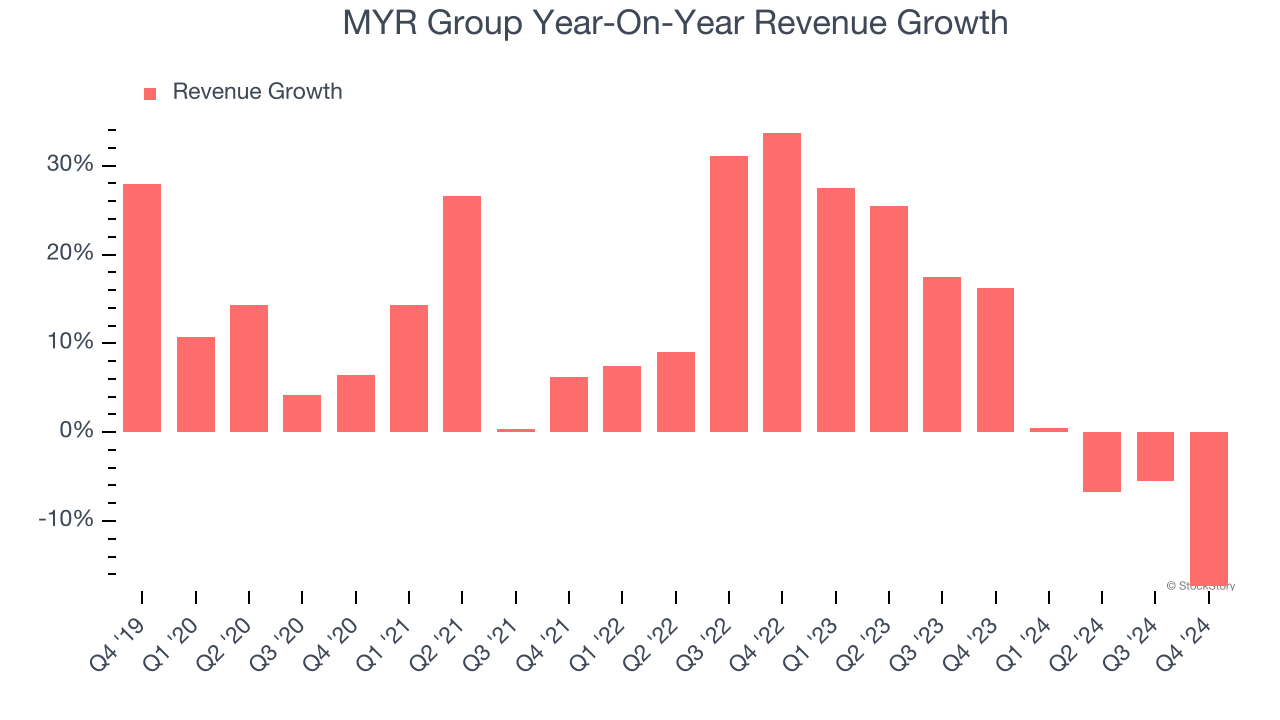
MYR Group also reports its backlog, or the value of its outstanding orders that have not yet been executed or delivered. MYR Group’s backlog reached $2.58 billion in the latest quarter and averaged 1.8% year-on-year growth over the last two years. Because this number is lower than its revenue growth, we can see the company hasn’t secured enough new orders to maintain its growth rate in the future. 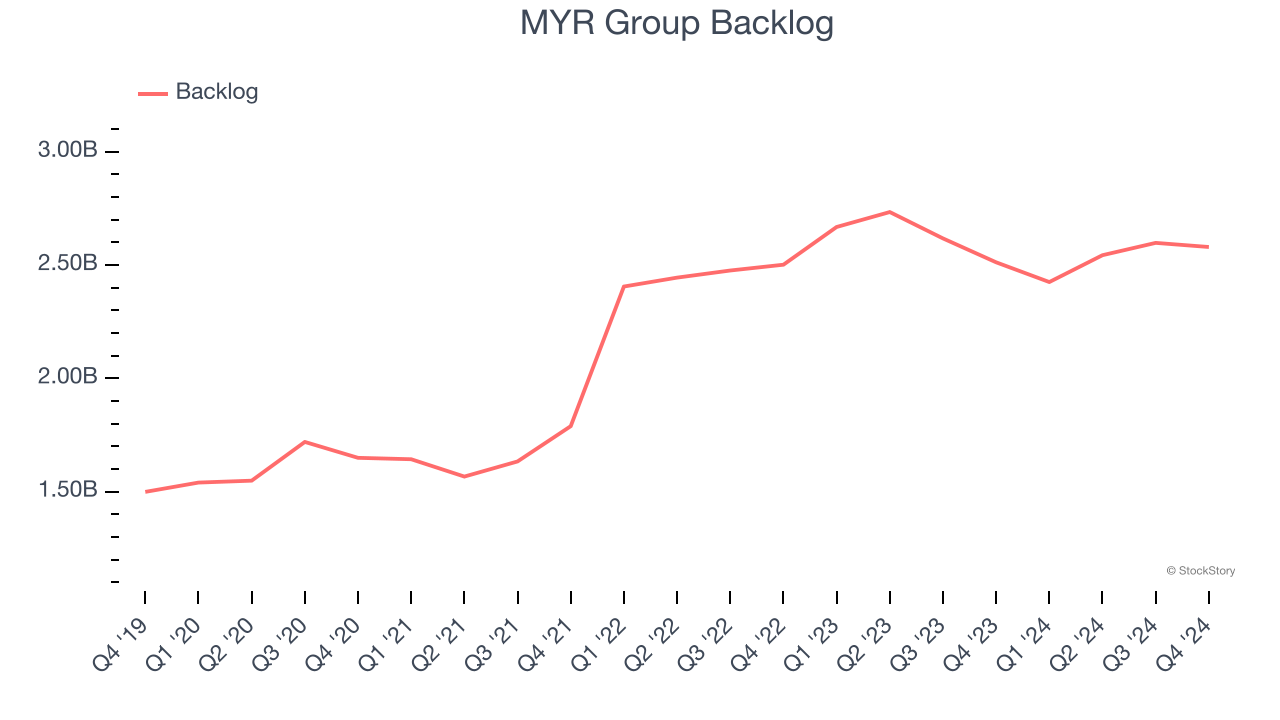
This quarter, MYR Group missed Wall Street’s estimates and reported a rather uninspiring 17.4% year-on-year revenue decline, generating $829.8 million of revenue.
Looking ahead, sell-side analysts expect revenue to grow 5.5% over the next 12 months, similar to its two-year rate. This projection is underwhelming and suggests its newer products and services will not lead to better top-line performance yet.
Software is eating the world and there is virtually no industry left that has been untouched by it. That drives increasing demand for tools helping software developers do their jobs, whether it be monitoring critical cloud infrastructure, integrating audio and video functionality, or ensuring smooth content streaming. Click here to access a free report on our 3 favorite stocks to play this generational megatrend.
Operating Margin
Operating margin is an important measure of profitability as it shows the portion of revenue left after accounting for all core expenses – everything from the cost of goods sold to advertising and wages. It’s also useful for comparing profitability across companies with different levels of debt and tax rates because it excludes interest and taxes.
MYR Group was profitable over the last five years but held back by its large cost base. Its average operating margin of 3.4% was weak for an industrials business. This result isn’t too surprising given its low gross margin as a starting point.
Looking at the trend in its profitability, MYR Group’s operating margin decreased by 2.2 percentage points over the last five years. This raises an eyebrow about the company’s expense base because its revenue growth should have given it leverage on its fixed costs, resulting in better economies of scale and profitability. . MYR Group’s performance was poor no matter how you look at it - it shows costs were rising and that it couldn’t pass them onto its customers.
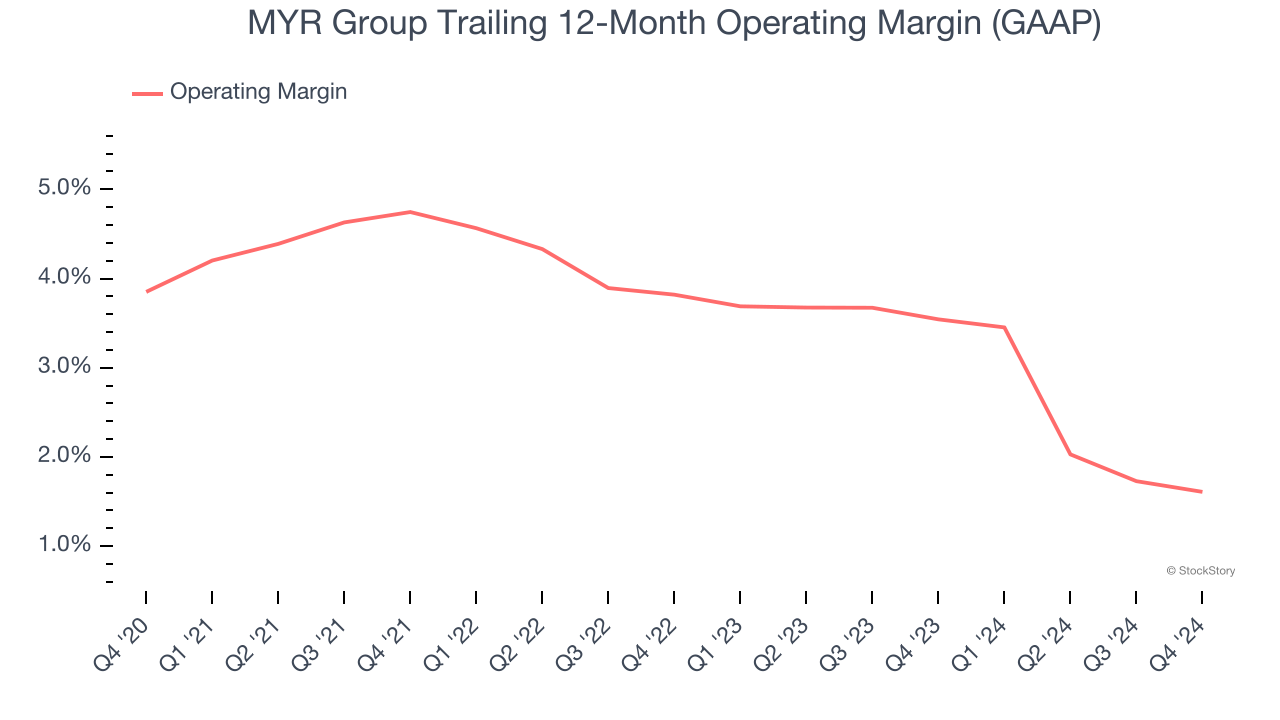
In Q4, MYR Group generated an operating profit margin of 3.6%, in line with the same quarter last year. This indicates the company’s cost structure has recently been stable.
Earnings Per Share
We track the long-term change in earnings per share (EPS) for the same reason as long-term revenue growth. Compared to revenue, however, EPS highlights whether a company’s growth is profitable.
Sadly for MYR Group, its EPS declined by 3.8% annually over the last five years while its revenue grew by 10.2%. This tells us the company became less profitable on a per-share basis as it expanded due to non-fundamental factors such as interest expenses and taxes.
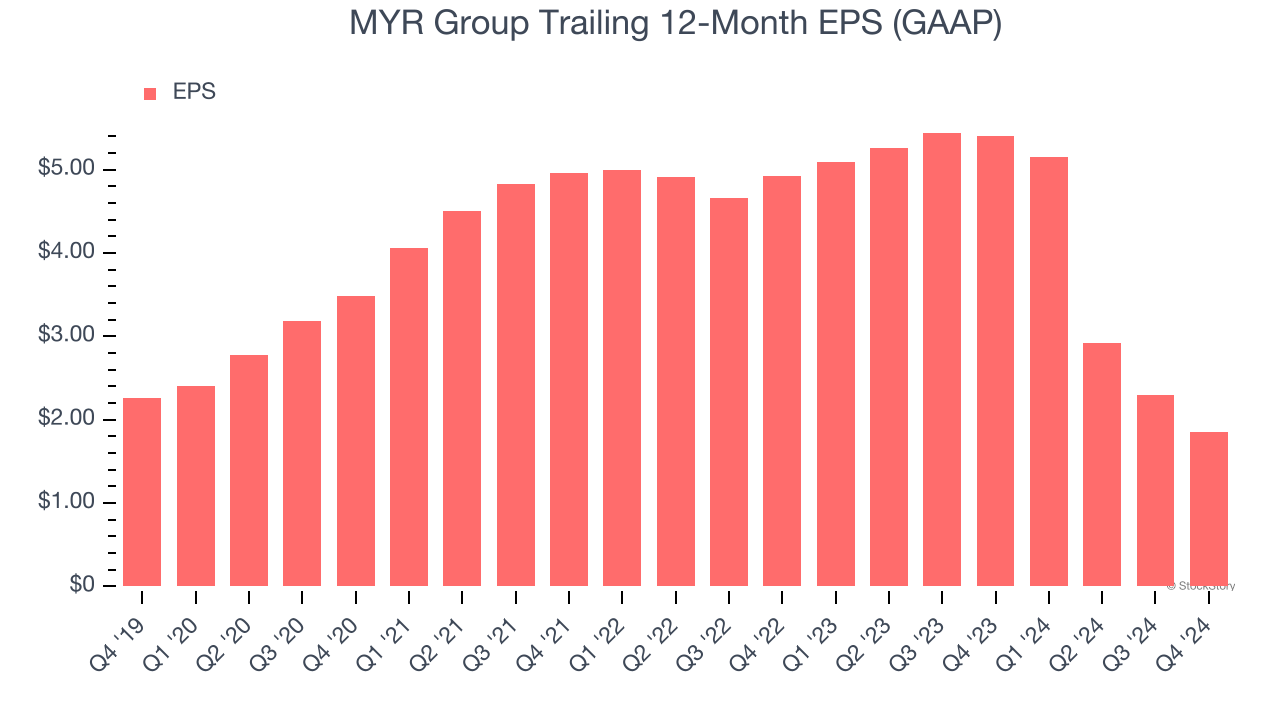
We can take a deeper look into MYR Group’s earnings to better understand the drivers of its performance. As we mentioned earlier, MYR Group’s operating margin was flat this quarter but declined by 2.2 percentage points over the last five years. This was the most relevant factor (aside from the revenue impact) behind its lower earnings; taxes and interest expenses can also affect EPS but don’t tell us as much about a company’s fundamentals.
Like with revenue, we analyze EPS over a shorter period to see if we are missing a change in the business.
For MYR Group, its two-year annual EPS declines of 38.5% show it’s continued to underperform. These results were bad no matter how you slice the data.
In Q4, MYR Group reported EPS at $0.99, down from $1.43 in the same quarter last year. Despite falling year on year, this print easily cleared analysts’ estimates. Over the next 12 months, Wall Street expects MYR Group’s full-year EPS of $1.86 to grow 207%.
Key Takeaways from MYR Group’s Q4 Results
We were impressed by how significantly MYR Group blew past analysts’ EBITDA and EPS expectations this quarter. On the other hand, its revenue missed and its backlog fell short of Wall Street’s estimates. Zooming out, we think this was a mixed quarter. The market seems to be focused on the positives and forgiving some of the negative, and the stock traded up 5% to $132.17 immediately following the results.
So should you invest in MYR Group right now? What happened in the latest quarter matters, but not as much as longer-term business quality and valuation, when deciding whether to invest in this stock. We cover that in our actionable full research report which you can read here, it’s free.


