Children’s apparel manufacturer Carter’s (NYSE: CRI) met Wall Street’s revenue expectations in Q3 2026, but revenue was flat year on year at $752.5 million. On the other hand, next quarter’s revenue guidance of $870 million was less impressive, coming in 5.8% below analysts’ consensus estimates. Its non-GAAP profit of $1.03 per share was 20.9% above analysts’ consensus estimates.
For more on Carter's, read our free full research report.
Carter's (CRI) Q3 2026 highlights:
- Revenue $752.5 million vs S&P analysts’ consensus estimates of $749.5 million (flat year on year, in line)
- Adjusted EPS $1.03 vs S&P analysts’ consensus estimates of $0.85 (20.9% beat)
- Adjusted EBITDA $69.5 million vs consensus estimates of $61.37 million (9.2% margin, 13.2% beat)
- Revenue guidance $870 million at the midpoint for Q4 2026, below consensus estimates of $924 million
- Adjusted EPS guidance $3.14 at the midpoint for the full year, missing consensus estimates by 0.8%
- Operating margin 7.4%, up from 3.8% in the same quarter last year
- Same-store sales were flat year on year (2% in the same quarter last year)
- Market capitalization $1.23 billion
Revenue growth
Examining a company’s long-term performance can provide clues about its quality. Even a bad business can perform well for one or two quarters, but a high-quality one grows for years. Carter's struggled to consistently generate demand over the last five years as its revenue dropped at a 2.7% annual rate. That underwhelming result points to poor business quality.
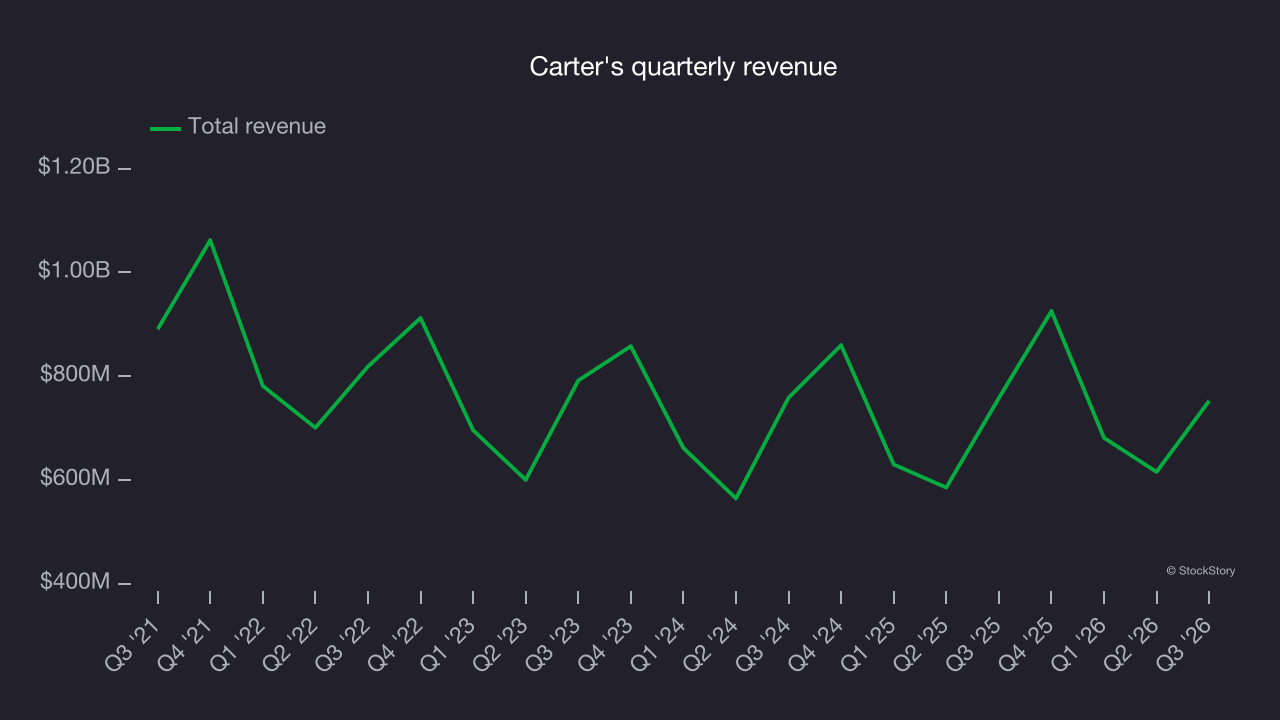
Long-term growth matters most, but within consumer discretionary, a stretched historical view may miss a company riding a successful new product or trend. Carter’s annualized revenue growth of 2.3% over the last two years is above its five-year trend, a positive sign. 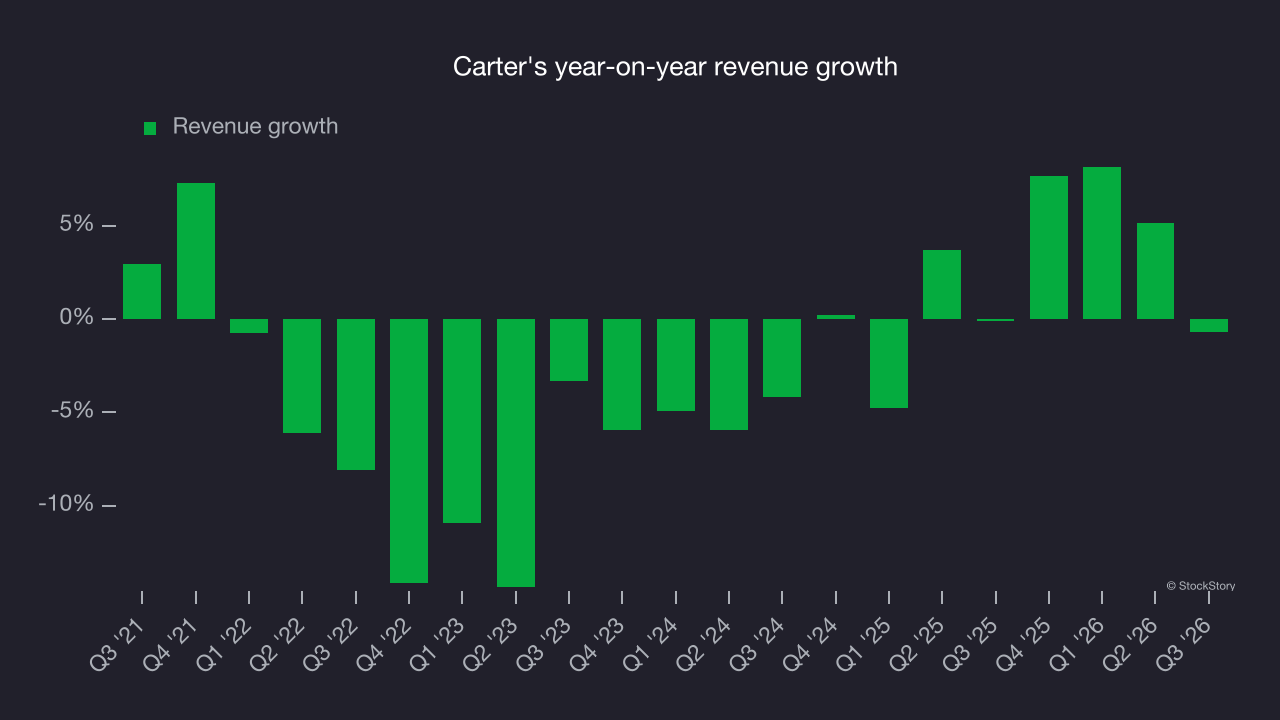
Same-store sales, which show how much revenue a company’s established locations generate, help explain its revenue dynamics. Over the last two years, Carter’s same-store sales averaged 2% year-on-year growth. That pace is unsurprising given its alignment with revenue growth. 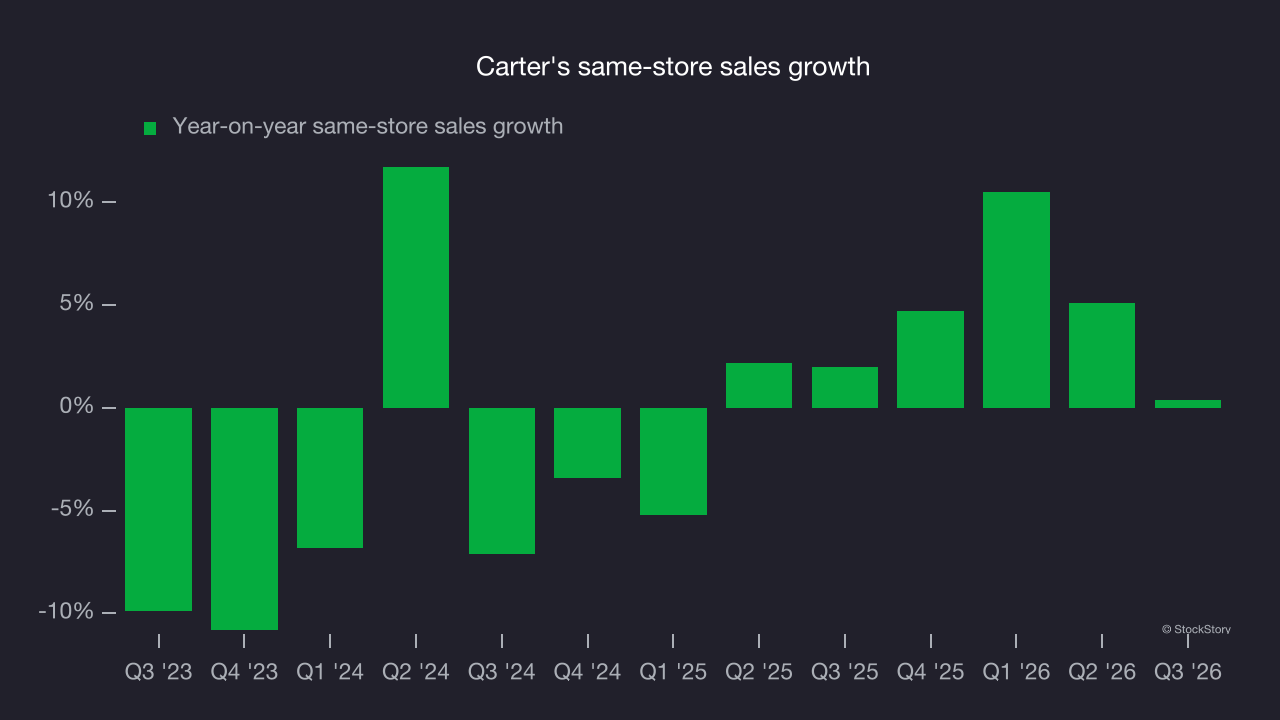
This quarter, Carter’s $752.5 million of revenue was flat year on year and in line with Wall Street’s consensus estimates. Management is guiding for a 6% year-on-year decline in revenue next quarter.
Looking further ahead, sell-side analysts expect revenue to remain flat over the next 12 months, according to S&P, a slight deceleration versus the last two years. This underwhelming projection suggests its products and services will face some demand headwinds.
Operating margin
Operating margin is an important measure of profitability as it shows the portion of revenue left after accounting for all core expenses, from the cost of goods sold to advertising and wages. It’s also useful for comparing profitability across companies with different levels of debt and tax rates because it excludes interest and taxes.
Carter’s operating margin has been trending up over the last 12 months and averaged 7.8% over the last two years. The company’s higher efficiency is a positive development, but its suboptimal cost structure means its profitability remains inadequate for a consumer discretionary business.
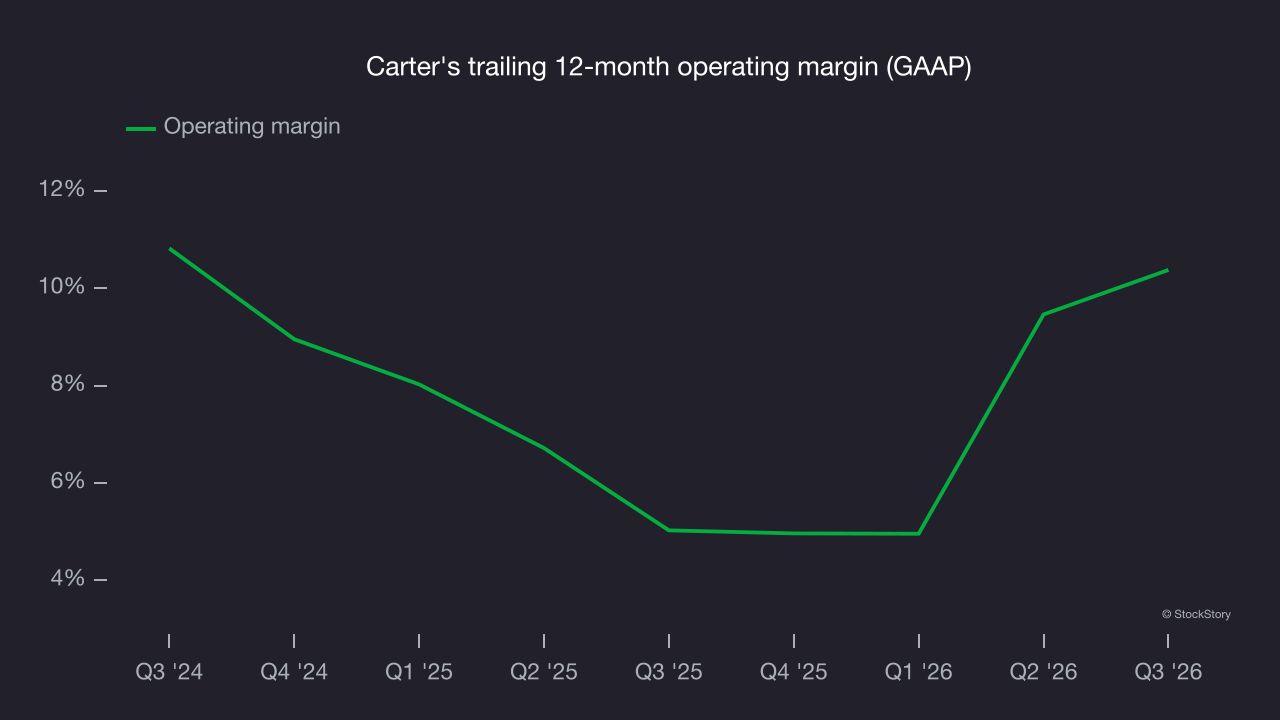
In Q3, Carter's generated an operating margin of 7.4%, up 3.6 percentage points year on year. This improvement shows it was more efficient.
Earnings per share
Revenue trends explain a company’s historical growth, but the long-term change in earnings per share (EPS) points to the profitability of that growth – for example, a company could inflate its revenue through excessive spending on advertising and promotions.
Carter's EPS declined by 14.9% annually over the last five years, more than its revenue. This indicates the company struggled because its fixed cost base made it difficult to adjust to shrinking demand.
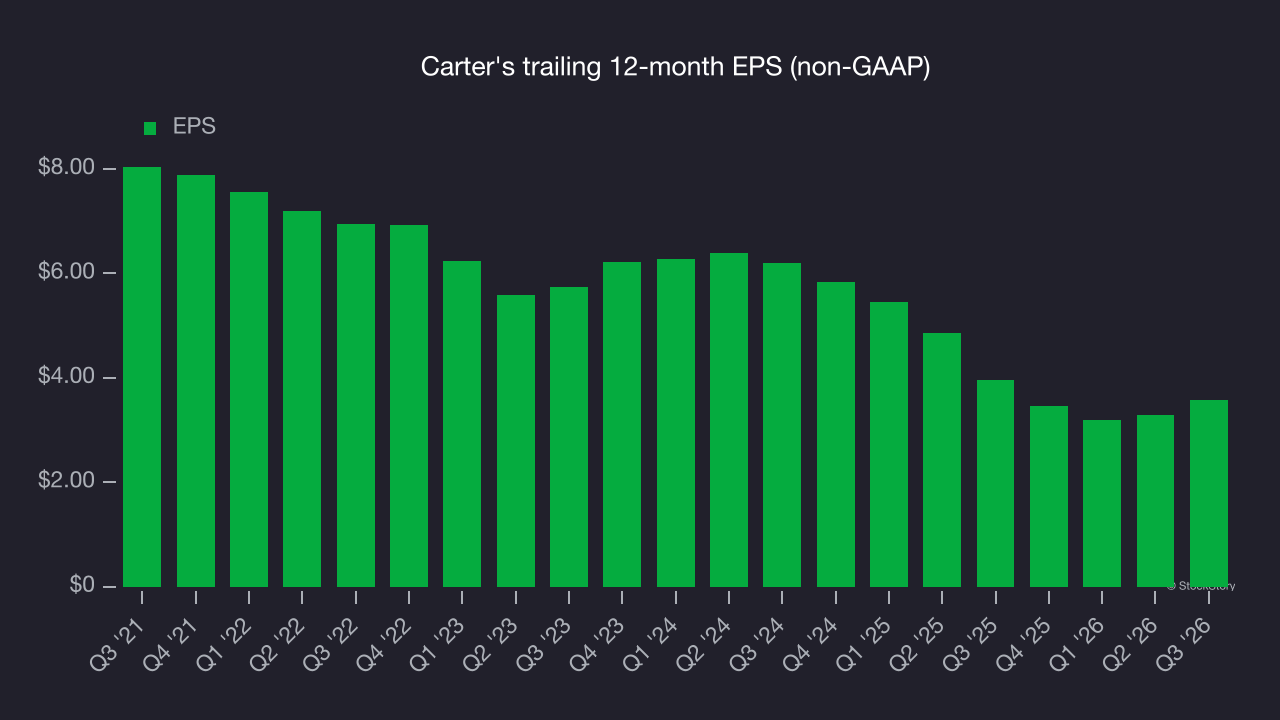
In Q3, Carter's reported adjusted EPS of $1.03, up from $0.74 in the same quarter last year. The result comfortably topped analysts’ consensus estimates, a positive outcome for shareholders. Over the next 12 months, Wall Street expects Carter’s full-year EPS to shrink by 5.7% from $3.58 to $3.38, according to S&P.
Key takeaways from Carter’s Q3 results
Carter’s topped consensus estimates for both EPS and EBITDA, but its outlook left room for improvement: Next-quarter EPS and revenue guidance both fell short of Wall Street’s consensus. Those shortfalls made for a quarter that could have been better despite the earnings beats. Shares fell 3.5% to $32.22 immediately after the results.
Carter’s earnings report left more to be desired. Assessing whether this quarter has created a buying opportunity requires looking ahead. What happened in the latest quarter matters, but not as much as longer-term business quality and valuation when deciding whether to invest in this stock. For more on Carter’s, read our full research report here (it’s free).