
Global entertainment and media company Warner Bros. Discovery (NASDAQ: WBD) met Wall Street’s revenue expectations in Q1 CY2026, but sales were flat year on year at $8.89 billion. Its GAAP loss of $1.17 per share was significantly below analysts’ consensus estimates.
Is now the time to buy Warner Bros. Discovery? Find out by accessing our full research report, it’s free.
Warner Bros. Discovery (WBD) Q1 CY2026 Highlights:
- Revenue: $8.89 billion vs analyst estimates of $8.90 billion (flat year on year, in line)
- EPS (GAAP): -$1.17 vs analyst estimates of -$0.09 (significant miss)
- Adjusted EBITDA: $438 million vs analyst estimates of $1.97 billion (4.9% margin, 77.8% miss)
- Operating Margin: -27.8%, down from -0.4% in the same quarter last year
- Free Cash Flow was -$476 million, down from $302 million in the same quarter last year
- Market Capitalization: $68.18 billion
Company Overview
Formed from the merger of WarnerMedia and Discovery, Warner Bros. Discovery (NASDAQ: WBD) is a multinational media and entertainment company, offering television networks, streaming services, and film and television production.
Revenue Growth
Examining a company’s long-term performance can provide clues about its quality. Any business can experience short-term success, but top-performing ones enjoy sustained growth for years. Over the last five years, Warner Bros. Discovery grew its sales at a 14.7% compounded annual growth rate. Though this growth is acceptable on an absolute basis, we need to see more than just topline growth for the consumer discretionary sector, which can display significant earnings volatility. This means our bar for the sector is particularly high, reflecting the non-essential and hit-driven nature of the products and services offered. Additionally, five-year CAGR starts around Covid, when revenue was depressed then rebounded.
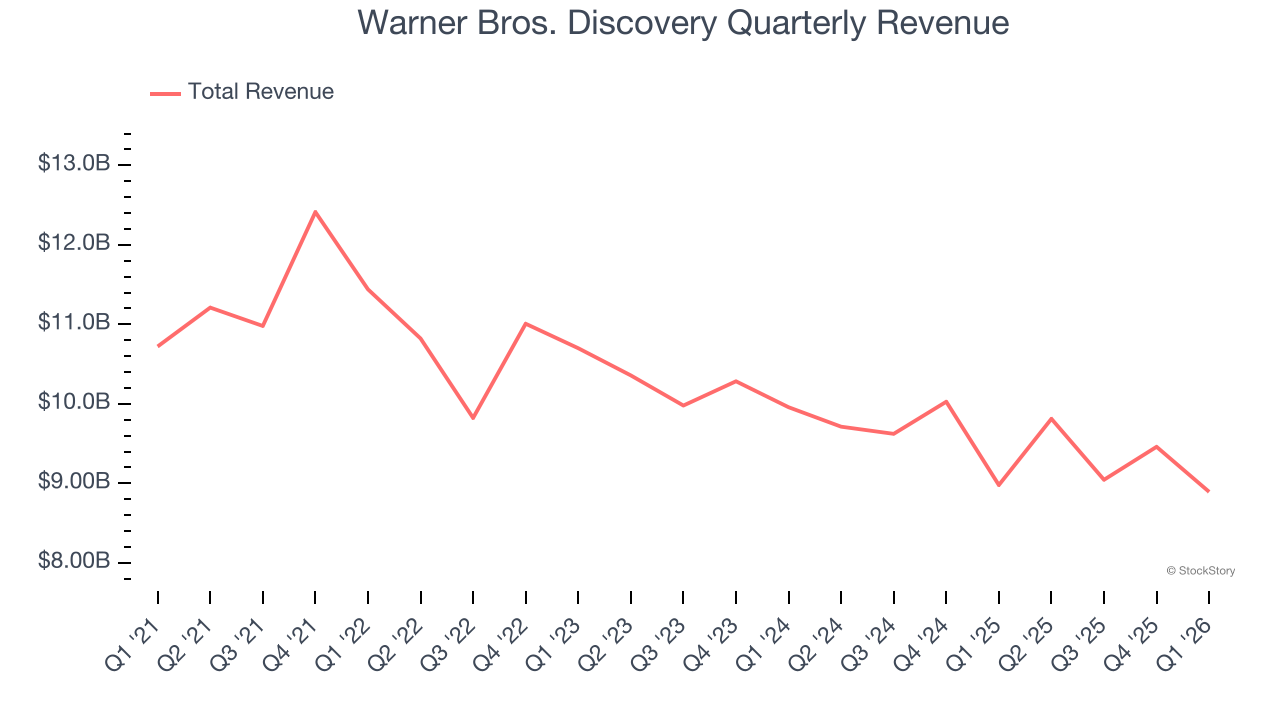
Long-term growth is the most important, but within consumer discretionary, product cycles are short and revenue can be hit-driven due to rapidly changing trends and consumer preferences. Warner Bros. Discovery’s performance shows it grew in the past but relinquished its gains over the last two years, as its revenue fell by 4.2% annually. 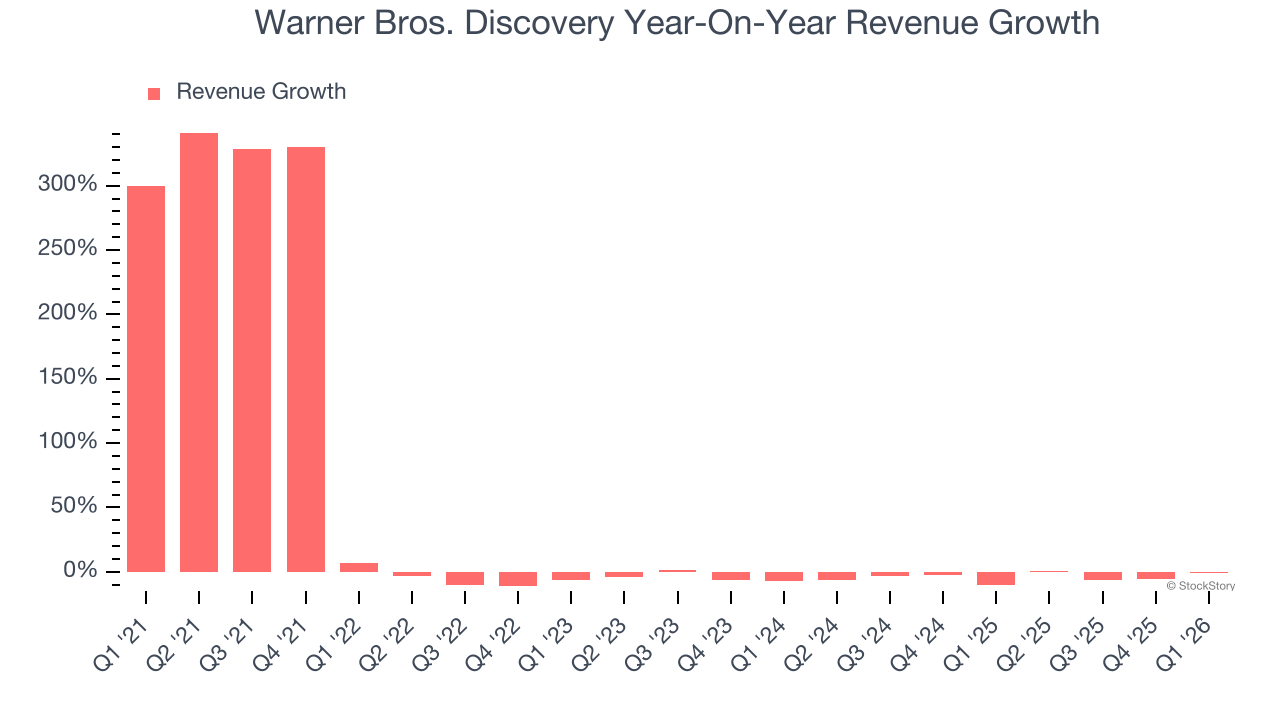
We can dig further into the company’s revenue dynamics by analyzing its three most important segments: Distribution, Advertising, and Content, which are 55.2%, 20.8%, and 21.2% of revenue. Over the last two years, Warner Bros. Discovery’s revenues in all three segments declined. Its Distribution revenue (licensing fees) averaged year-on-year decreases of 1.4% while its Advertising (marketing services) and Content (films, streaming, games) revenues averaged drops of 9.8% and 3.6%. 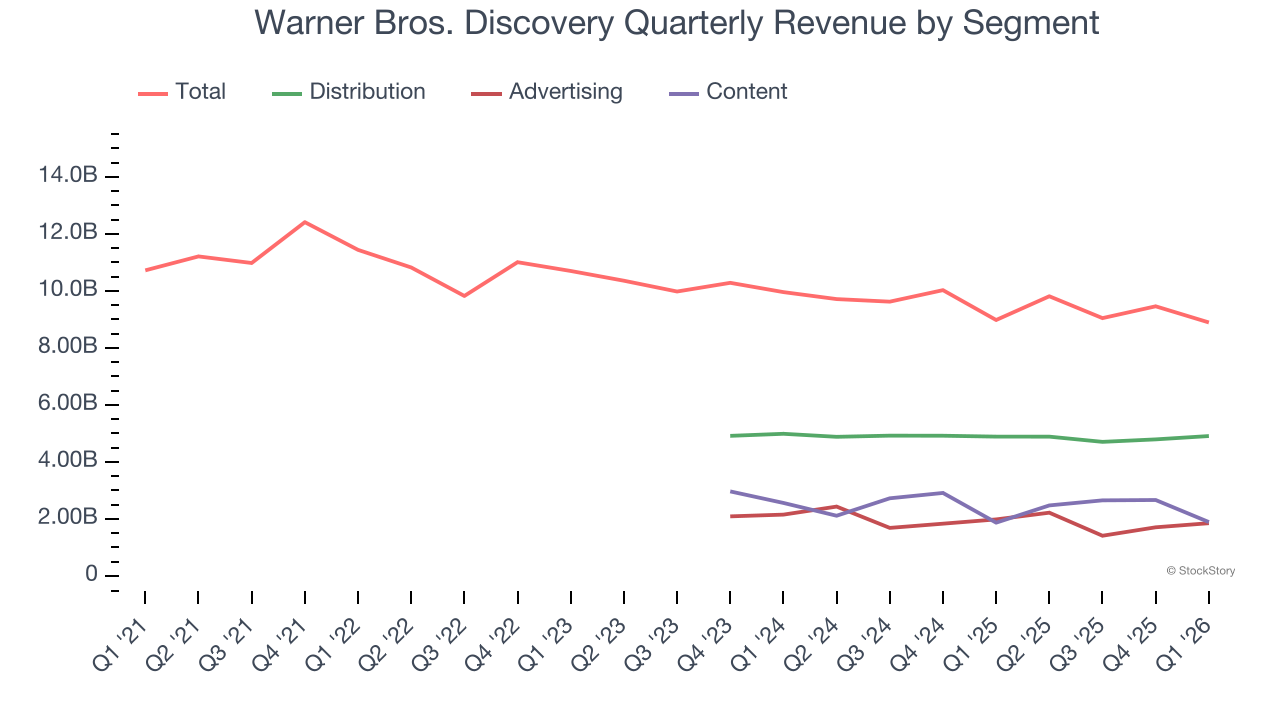
This quarter, Warner Bros. Discovery’s $8.89 billion of revenue was flat year on year and in line with Wall Street’s estimates.
Looking ahead, sell-side analysts expect revenue to grow 1.4% over the next 12 months. Although this projection suggests its newer products and services will fuel better top-line performance, it is still below the sector average.
ONE MORE THING: The $21 AI Application Stock Wall Street Forgot. While Wall Street obsesses over who’s building AI, one company is already using it to print money. And nobody’s paying attention.
AI chip stocks trade at ridiculous valuations. This company processes a trillion consumer signals monthly using AI and trades at a third of the price. The gap won’t last. The institutions will figure it out. You need to see this first. Read the FREE Report Before They Notice.
Operating Margin
Operating margin is a key measure of profitability. Think of it as net income - the bottom line - excluding the impact of taxes and interest on debt, which are less connected to business fundamentals.
Warner Bros. Discovery’s operating margin has risen over the last 12 months, but it still averaged negative 15.2% over the last two years. This is due to its large expense base and inefficient cost structure.
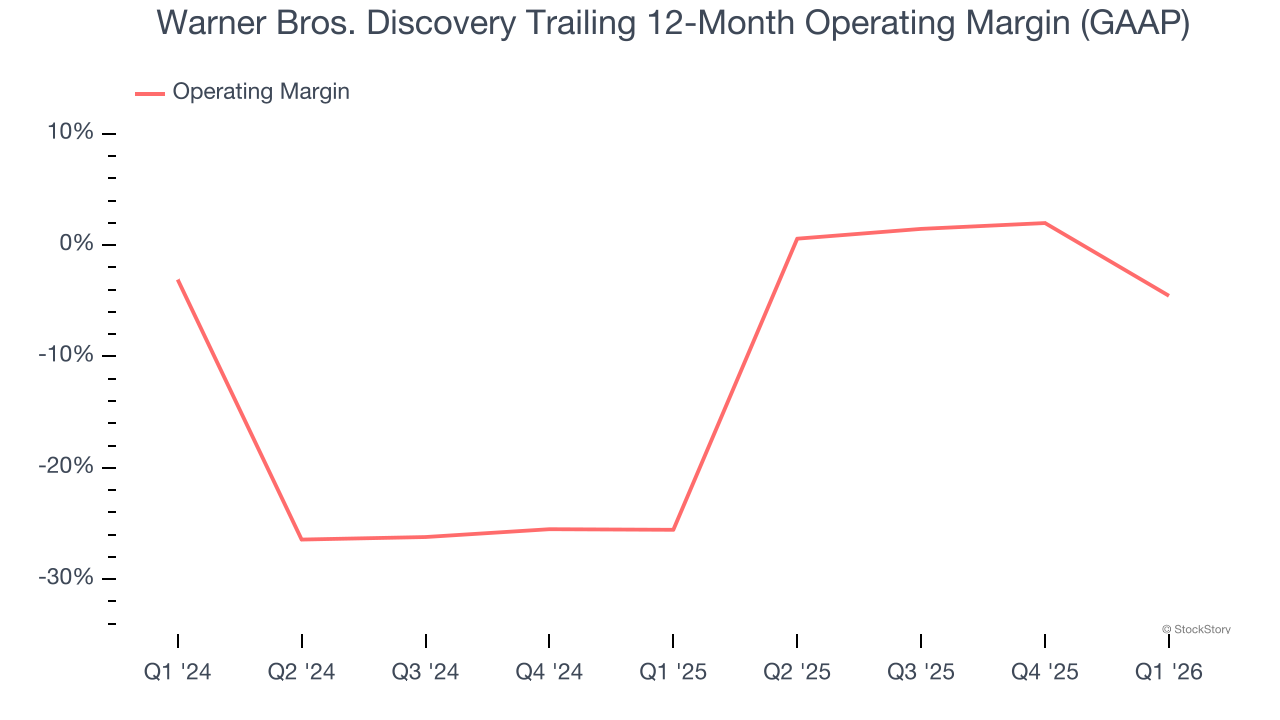
In Q1, Warner Bros. Discovery generated a negative 27.8% operating margin. The company's consistent lack of profits raise a flag.
Earnings Per Share
We track the long-term change in earnings per share (EPS) for the same reason as long-term revenue growth. Compared to revenue, however, EPS highlights whether a company’s growth is profitable.
Although Warner Bros. Discovery’s full-year earnings are still negative, it reduced its losses and improved its EPS by 14.2% annually over the last five years. The next few quarters will be critical for assessing its long-term profitability.
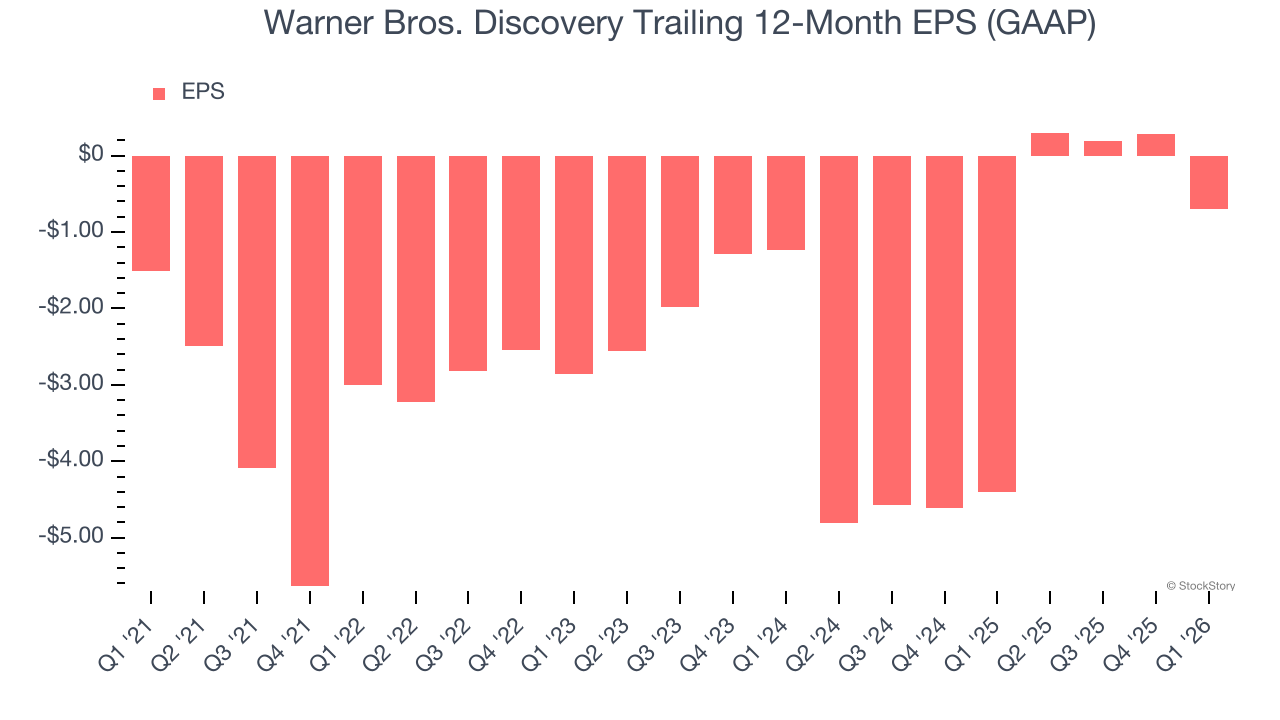
In Q1, Warner Bros. Discovery reported EPS of negative $1.17, down from negative $0.18 in the same quarter last year. This print missed analysts’ estimates. Over the next 12 months, Wall Street expects Warner Bros. Discovery to improve its earnings losses. Analysts forecast its full-year EPS of negative $0.70 will advance to negative $0.03.
Key Takeaways from Warner Bros. Discovery’s Q1 Results
We struggled to find many positives in these results. Its adjusted operating income missed and its EBITDA fell short of Wall Street’s estimates. Overall, this was a weaker quarter. The stock remained flat at $27.25 immediately following the results.
So should you invest in Warner Bros. Discovery right now? If you’re making that decision, you should consider the bigger picture of valuation, business qualities, as well as the latest earnings. We cover that in our actionable full research report which you can read here (it’s free).