
Oil and gas company Granite Ridge Resources (NYSE: GRNT) missed Wall Street’s revenue expectations in Q1 CY2026 as sales rose 4.3% year on year to $128.3 million. Its non-GAAP profit of $0.02 per share was 82.8% below analysts’ consensus estimates.
Is now the time to buy Granite Ridge Resources? Find out by accessing our full research report, it’s free.
Granite Ridge Resources (GRNT) Q1 CY2026 Highlights:
- Revenue: $128.3 million vs analyst estimates of $129.5 million (4.3% year-on-year growth, 0.9% miss)
- Adjusted EPS: $0.02 vs analyst expectations of $0.12 (82.8% miss)
- Adjusted EBITDA: $71 million vs analyst estimates of $87.74 million (55.4% margin, 19.1% miss)
- Operating Margin: 11.6%, down from 34.6% in the same quarter last year
- Free Cash Flow was -$2.03 million, down from $9.36 million in the same quarter last year
- Oil production: up 11.4% year on year
- Market Capitalization: $738.7 million
Company Overview
Operating without drilling rigs or field crews of its own, Granite Ridge Resources (NYSE: GRNT) owns interests in oil and natural gas wells across six major US shale basins.
Revenue Growth
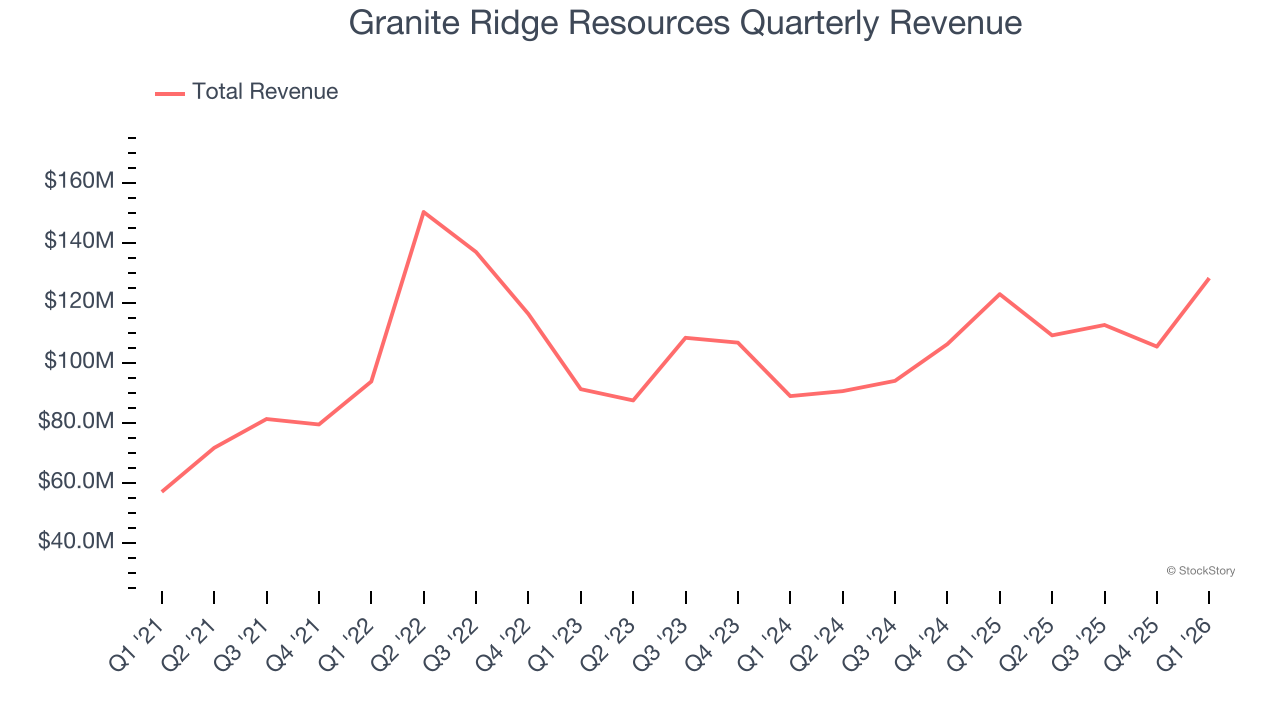
Cyclical industries such as Energy can make mediocre companies look great for a time, but a long-term view reveals which businesses can actually withstand and adapt to changing conditions. Regrettably, Granite Ridge Resources’s sales grew at a mediocre 8.7% compounded annual growth rate over the last four years. This was below our standard for the energy upstream and integrated energy sector and is a tough starting point for our analysis.
While looking at revenue is important, it can also introduce noise around commodity prices and M&A. Analyzing production, on the other hand, highlights what is happening inside the asset base and whether the economic footprint of a company is expanding. Over the last two years, Granite Ridge Resources’s oil production averaged 21% year-on-year growth. 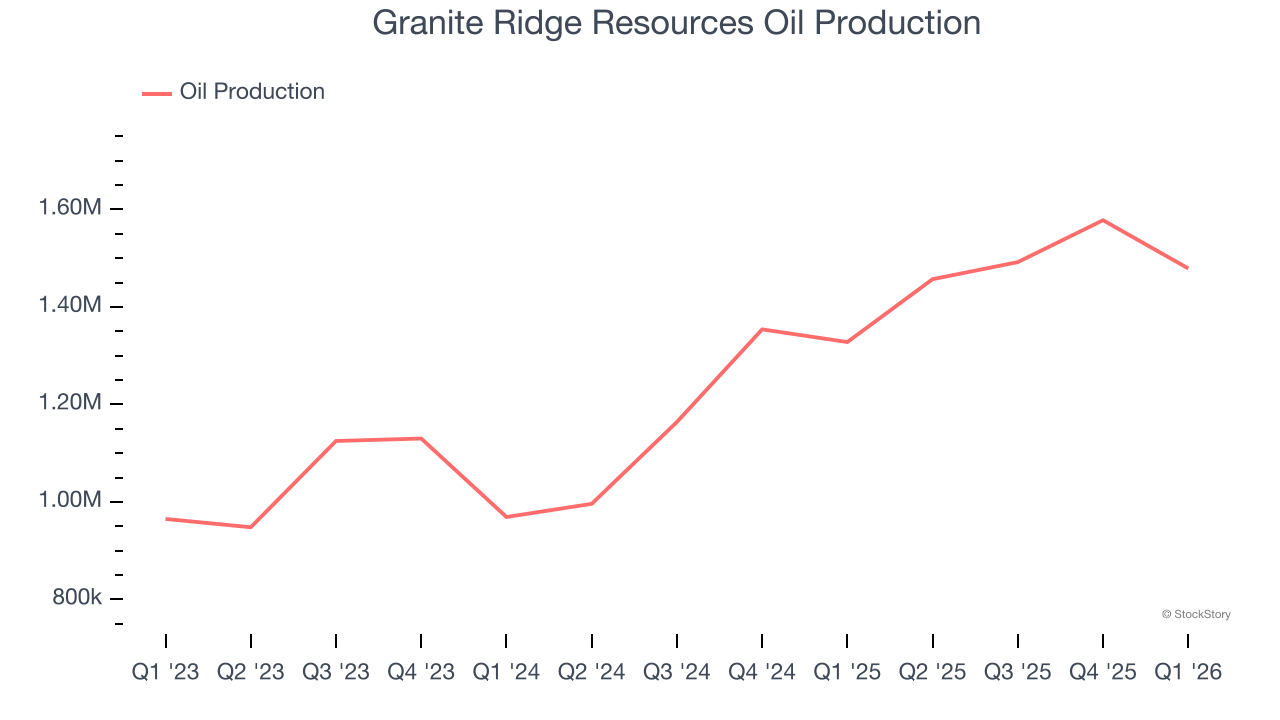
This quarter, Granite Ridge Resources’s revenue grew by 4.3% year on year to $128.3 million, falling short of Wall Street’s estimates. This quarter, Granite Ridge Resources reported year-on-year Oil production growth of 11.4%.
ALSO WORTH WATCHING: Nvidia’s Quiet Partner. Nvidia’s chips cost a hundred grand. The connectors that make them work cost even more. One company makes them all.
Every AI server needs specialized infrastructure the chip companies don’t make. High-speed cables. Power connectors. Thermal sensors. This 90-year-old company built a monopoly on it. The AI boom just started. This stock is still flying under the radar. Claim The Stock Ticker Here for FREE.
Adjusted EBITDA Margin
Granite Ridge Resources has been a well-oiled machine over the last five years. It demonstrated elite profitability for an upstream and integrated energy business, boasting an average EBITDA margin of 78%.
Analyzing the trend in its profitability, Granite Ridge Resources’s EBITDA margin decreased by 33.9 percentage points over the last year. Even though its historical margin was healthy, shareholders will want to see Granite Ridge Resources become more profitable in the future.
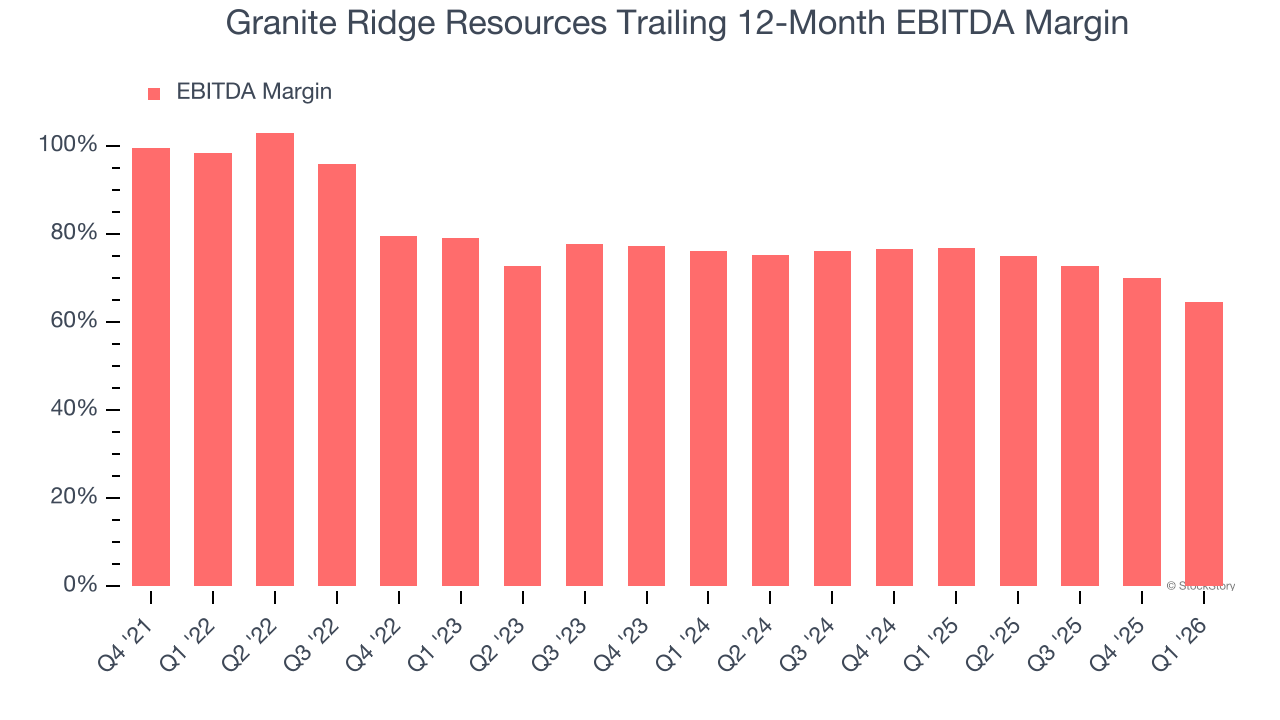
This quarter, Granite Ridge Resources generated an EBITDA margin profit margin of 55.4%, down 19 percentage points year on year. This contraction shows it was less efficient because its expenses grew faster than its revenue. This adjusted EBITDA fell short of Wall Street’s estimates.
Cash Is King
Adjusted EBITDA shows how profitable a company’s existing wells are before financing and reinvestment decisions, but free cash flow shows how much value remains after paying the cost of replacing those wells. In upstream energy, production naturally declines over time, so companies must continuously reinvest just to stand still. A producer can report strong EBITDA margins yet generate little or no free cash flow if its wells decline quickly or if new drilling is expensive. Free cash flow therefore captures not only how efficiently a company produces hydrocarbons today, but also how costly it is to sustain that production into the future.
Granite Ridge Resources has shown mediocre cash profitability relative to peers over the last five years, giving the company fewer opportunities to return capital to shareholders. Its free cash flow margin averaged 5.3%, below what we’d expect for an upstream and integrated energy business.
While the level of free cash flow margins is important, their consistency matters just as much.
Granite Ridge Resources’s ratio of quarterly free cash flow volatility to WTI crude price volatility over the past five years was 32.3 (lower is better), indicating that its cash generation is far more sensitive to commodity-price swings than most peers. This elevated volatility limits its access to capital in downturns and makes it unlikely to act as a consolidator when weaker competitors come under pressure.
You may be asking why we wait until the free cash flow line to perform this stability analysis versus commodity prices. Why not compare revenue or EBITDA to WTI Crude prices in the case of Granite Ridge Resources? Because what ultimately matters is not how much revenue or profit you earn when prices are high but how much cash you can generate when prices are low. Free cash flow is the superior metric because it includes everything from hedging prowess to growth and maintenance capex to management behavior during good times and bad.
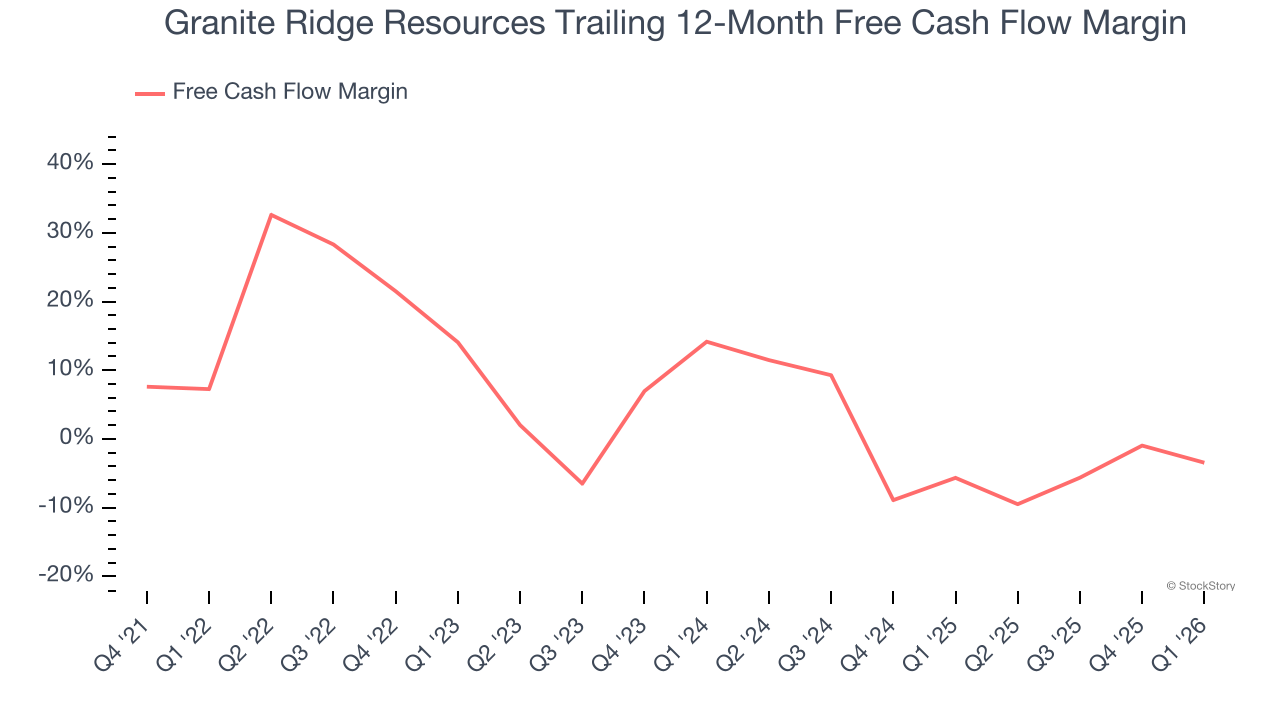
Granite Ridge Resources burned through $2.03 million of cash in Q1, equivalent to a negative 1.6% margin. The company’s cash flow turned negative after being positive in the same quarter last year, suggesting its historical struggles have dragged on.
Key Takeaways from Granite Ridge Resources’s Q1 Results
We struggled to find many positives in these results. Its EBITDA missed and its EPS fell short of Wall Street’s estimates. Overall, this was a weaker quarter. The stock traded down 1.5% to $5.51 immediately following the results.
Granite Ridge Resources’s earnings report left more to be desired. Let’s look forward to see if this quarter has created an opportunity to buy the stock. The latest quarter does matter, but not nearly as much as longer-term fundamentals and valuation, when deciding if the stock is a buy. We cover that in our actionable full research report which you can read here (it’s free).


