Bedding manufacturer Somnigroup (NYSE: SGI) missed Wall Street’s revenue expectations in Q1 CY2026, but sales rose 12.3% year on year to $1.80 billion. Its non-GAAP profit of $0.59 per share was 2.8% above analysts’ consensus estimates.
Is now the time to buy Somnigroup? Find out by accessing our full research report, it’s free.
Somnigroup (SGI) Q1 CY2026 Highlights:
- Revenue: $1.80 billion vs analyst estimates of $1.83 billion (12.3% year-on-year growth, 1.6% miss)
- Adjusted EPS: $0.59 vs analyst estimates of $0.57 (2.8% beat)
- Adjusted EBITDA: $296.8 million vs analyst estimates of $302.6 million (16.5% margin, 1.9% miss)
- Management reiterated its full-year Adjusted EPS guidance of $3.20 at the midpoint
- Operating Margin: 10.4%, up from 0.8% in the same quarter last year
- Free Cash Flow Margin: 10.3%, up from 5.1% in the same quarter last year
- Market Capitalization: $16.54 billion
Company Chairman and CEO Scott Thompson commented, "While navigating challenging market conditions, we delivered solid financial results this quarter, including a robust 20% increase in adjusted EPS. Our performance in this muted market environment reflects the strength of our business and our continued focus on operational discipline and supporting our customers. Our scale, trusted brands, and omnichannel capabilities provide a solid foundation to succeed and support long–term value creation."
Company Overview
Established through the merger of Tempur-Pedic and Sealy in 2012, Somnigroup (NYSE: SGI) is a bedding manufacturer known for its innovative memory foam mattresses and sleep products
Revenue Growth
Examining a company’s long-term performance can provide clues about its quality. Any business can experience short-term success, but top-performing ones enjoy sustained growth for years. Over the last five years, Somnigroup grew its sales at a 14.5% compounded annual growth rate. Though this growth is acceptable on an absolute basis, we need to see more than just topline growth for the consumer discretionary sector, which can display significant earnings volatility. This means our bar for the sector is particularly high, reflecting the non-essential and hit-driven nature of the products and services offered. Additionally, five-year CAGR starts around Covid, when revenue was depressed then rebounded.
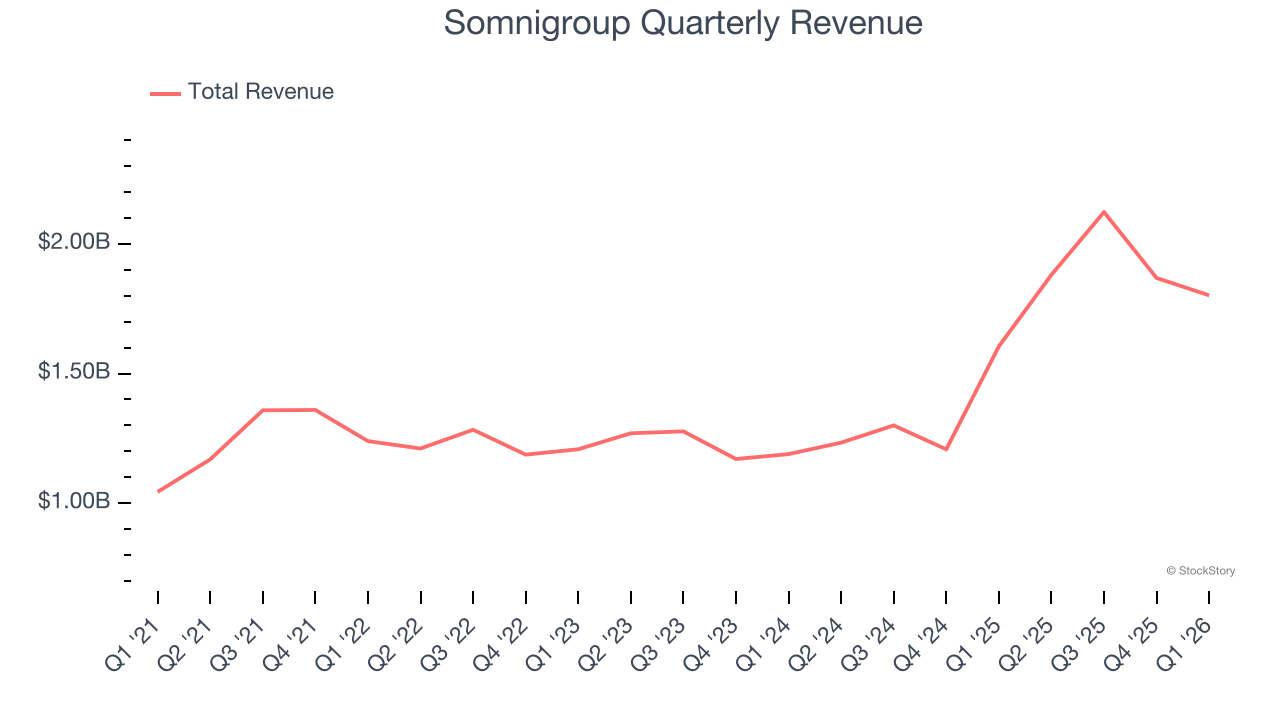
Long-term growth is the most important, but within consumer discretionary, product cycles are short and revenue can be hit-driven due to rapidly changing trends and consumer preferences. Somnigroup’s annualized revenue growth of 25.1% over the last two years is above its five-year trend, which is encouraging. 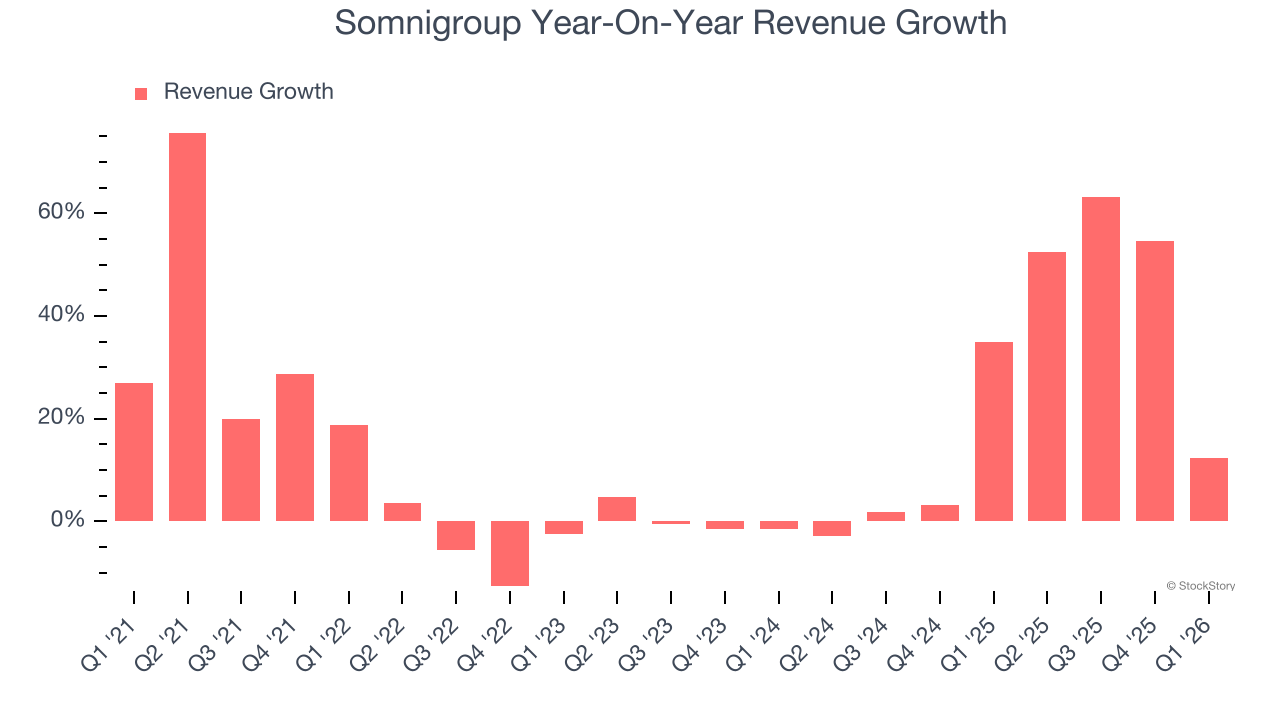
Somnigroup also breaks out the revenue for its most important segments, Wholesale and Direct, which are 33.6% and 66.4% of revenue. Over the last two years, Somnigroup’s Wholesale revenue (sales to retailers) averaged 16.5% year-on-year declines. On the other hand, its Direct revenue (sales made directly to consumers) averaged 170% growth. 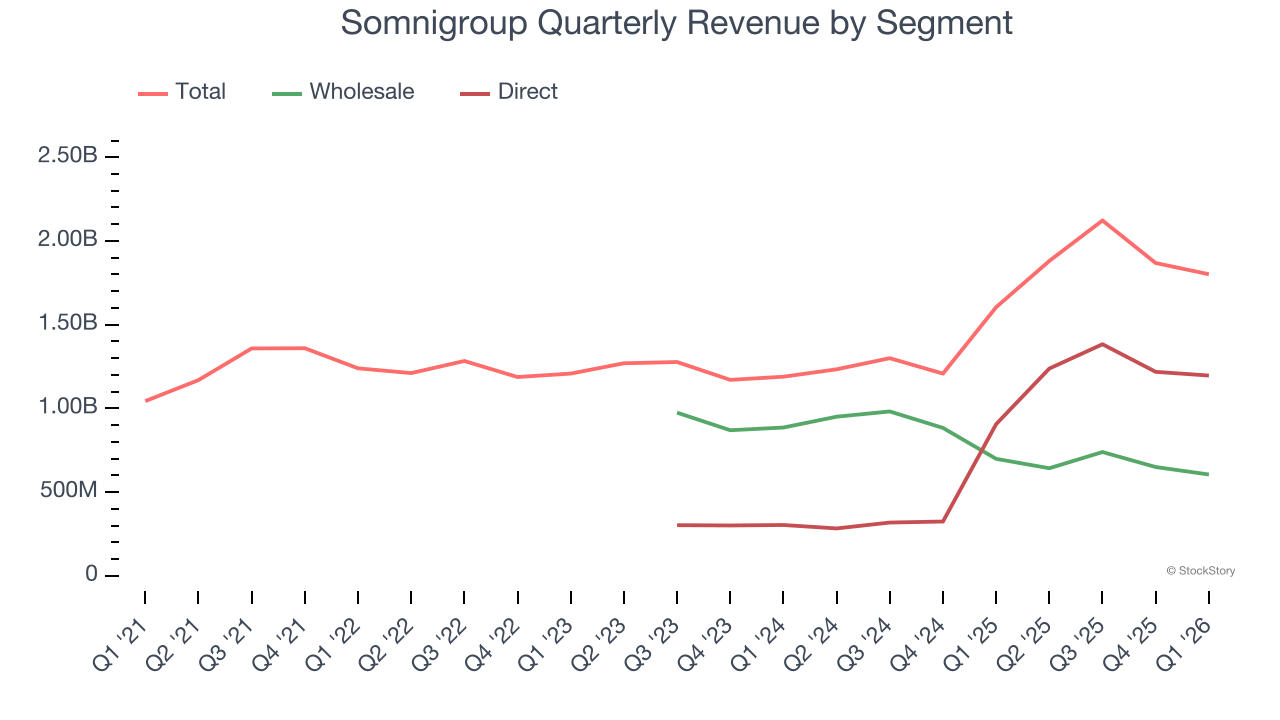
This quarter, Somnigroup’s revenue grew by 12.3% year on year to $1.80 billion but fell short of Wall Street’s estimates.
Looking ahead, sell-side analysts expect revenue to grow 4.7% over the next 12 months, a deceleration versus the last two years. This projection is underwhelming and implies its products and services will face some demand challenges.
ALSO WORTH WATCHING: Nvidia’s Quiet Partner. Nvidia’s chips cost a hundred grand. The connectors that make them work cost even more. One company makes them all.
Every AI server needs specialized infrastructure the chip companies don’t make. High-speed cables. Power connectors. Thermal sensors. This 90-year-old company built a monopoly on it. The AI boom just started. This stock is still flying under the radar. Claim The Stock Ticker Here for FREE.
Operating Margin
Somnigroup’s operating margin has been trending up over the last 12 months and averaged 11.1% over the last two years. The company’s higher efficiency is a breath of fresh air, but its suboptimal cost structure means it still sports inadequate profitability for a consumer discretionary business.
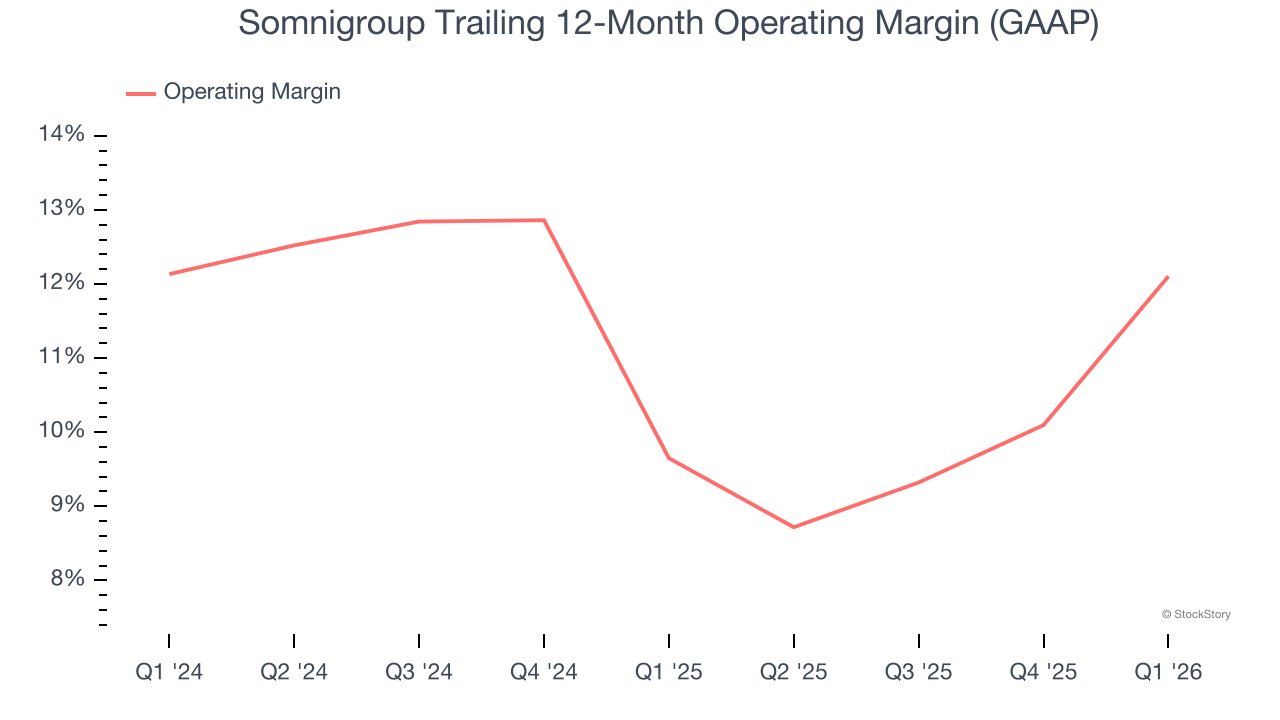
In Q1, Somnigroup generated an operating margin profit margin of 10.4%, up 9.6 percentage points year on year. This increase was a welcome development and shows it was more efficient.
Earnings Per Share
Revenue trends explain a company’s historical growth, but the long-term change in earnings per share (EPS) points to the profitability of that growth – for example, a company could inflate its sales through excessive spending on advertising and promotions.
Somnigroup’s EPS grew at a weak 4.7% compounded annual growth rate over the last five years, lower than its 14.5% annualized revenue growth. This tells us the company became less profitable on a per-share basis as it expanded.
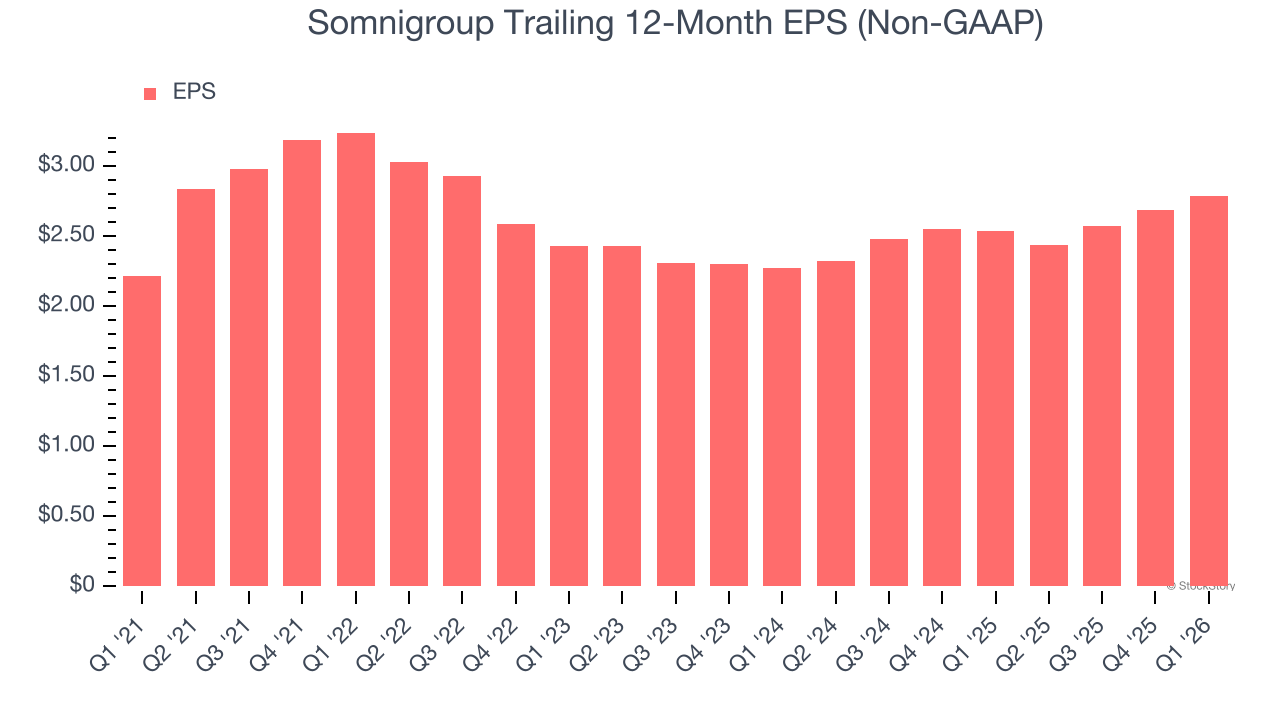
In Q1, Somnigroup reported adjusted EPS of $0.59, up from $0.49 in the same quarter last year. This print beat analysts’ estimates by 2.8%. Over the next 12 months, Wall Street expects Somnigroup’s full-year EPS of $2.79 to grow 21.9%.
Key Takeaways from Somnigroup’s Q1 Results
Revenue missed but EPS beat. Looking ahead, full-year EPS guidance was reiterated. Overall, this quarter was mixed. The stock traded up 3.3% to $81.21 immediately following the results.
Big picture, is Somnigroup a buy here and now? When making that decision, it’s important to consider its valuation, business qualities, as well as what has happened in the latest quarter. We cover that in our actionable full research report which you can read here (it’s free).