
Food distribution giant US Foods (NYSE: USFD) missed Wall Street’s revenue expectations in Q1 CY2026 as sales rose 2.8% year on year to $9.61 billion. Its non-GAAP profit of $0.78 per share was 3.6% below analysts’ consensus estimates.
Is now the time to buy US Foods? Find out by accessing our full research report, it’s free.
US Foods (USFD) Q1 CY2026 Highlights:
- Revenue: $9.61 billion vs analyst estimates of $9.66 billion (2.8% year-on-year growth, 0.5% miss)
- Adjusted EPS: $0.78 vs analyst expectations of $0.81 (3.6% miss)
- Adjusted EBITDA: $413 million vs analyst estimates of $423.8 million (4.3% margin, 2.5% miss)
- Operating Margin: 2.2%, in line with the same quarter last year
- Free Cash Flow Margin: 2%, down from 3.3% in the same quarter last year
- Sales Volumes rose 1.4% year on year, in line with the same quarter last year
- Market Capitalization: $20.27 billion
Company Overview
With a fleet of over 6,500 trucks delivering everything from fresh produce to frozen entrées, US Foods (NYSE: USFD) is a major foodservice distributor that supplies food products and services to approximately 250,000 restaurants, healthcare facilities, hotels, and educational institutions across the United States.
Revenue Growth
Examining a company’s long-term performance can provide clues about its quality. Any business can have short-term success, but a top-tier one grows for years. Over the last five years, US Foods grew its sales at a 11.7% annual rate. Though this growth is acceptable on an absolute basis, we need to see more than just topline growth for the consumer discretionary sector, which can display significant earnings volatility. This means our bar for the sector is particularly high, reflecting the non-essential and hit-driven nature of the products and services offered. Additionally, five-year CAGR starts around Covid, when revenue was depressed then rebounded.

We at StockStory place the most emphasis on long-term growth, but within consumer discretionary, a stretched historical view may miss a company riding a successful new product or trend. US Foods’s recent performance shows its demand has slowed as its annualized revenue growth of 5% over the last two years was below its five-year trend. We’re wary when companies in the sector see decelerations in revenue growth, as it could signal changing consumer tastes aided by low switching costs. 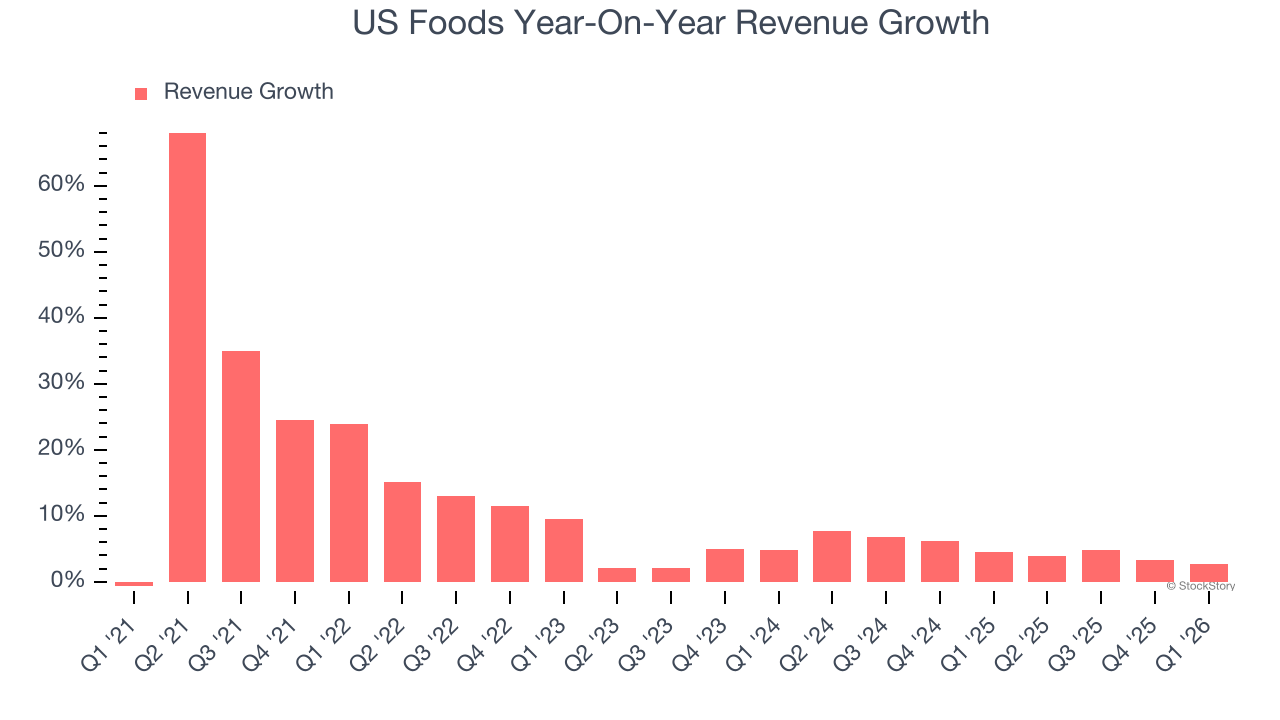
We can dig further into the company’s revenue dynamics by analyzing its number of units sold. Over the last two years, US Foods’s units sold averaged 2.4% year-on-year growth. Because this number is lower than its revenue growth, we can see the company benefited from price increases. 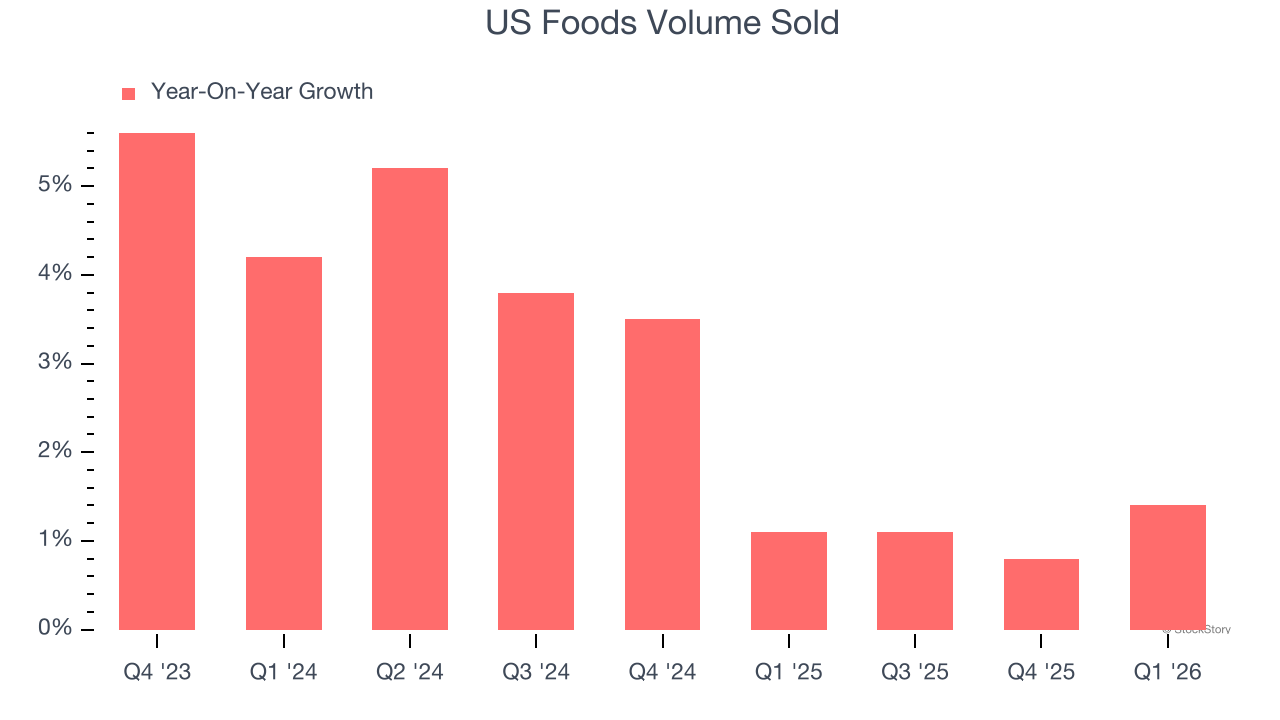
This quarter, US Foods’s revenue grew by 2.8% year on year to $9.61 billion, falling short of Wall Street’s estimates.
Looking ahead, sell-side analysts expect revenue to grow 6% over the next 12 months, similar to its two-year rate. Although this projection implies its newer products and services will catalyze better top-line performance, it is still below the sector average.
ONE MORE THING: The $21 AI Application Stock Wall Street Forgot. While Wall Street obsesses over who’s building AI, one company is already using it to print money. And nobody’s paying attention.
AI chip stocks trade at ridiculous valuations. This company processes a trillion consumer signals monthly using AI and trades at a third of the price. The gap won’t last. The institutions will figure it out. You need to see this first. Read the FREE Report Before They Notice.
Operating Margin
Operating margin is a key measure of profitability. Think of it as net income - the bottom line - excluding the impact of taxes and interest on debt, which are less connected to business fundamentals.
US Foods’s operating margin has generally stayed the same over the last 12 months, and we generally like to see margin increases due to economies of scale and cost efficiency over time.
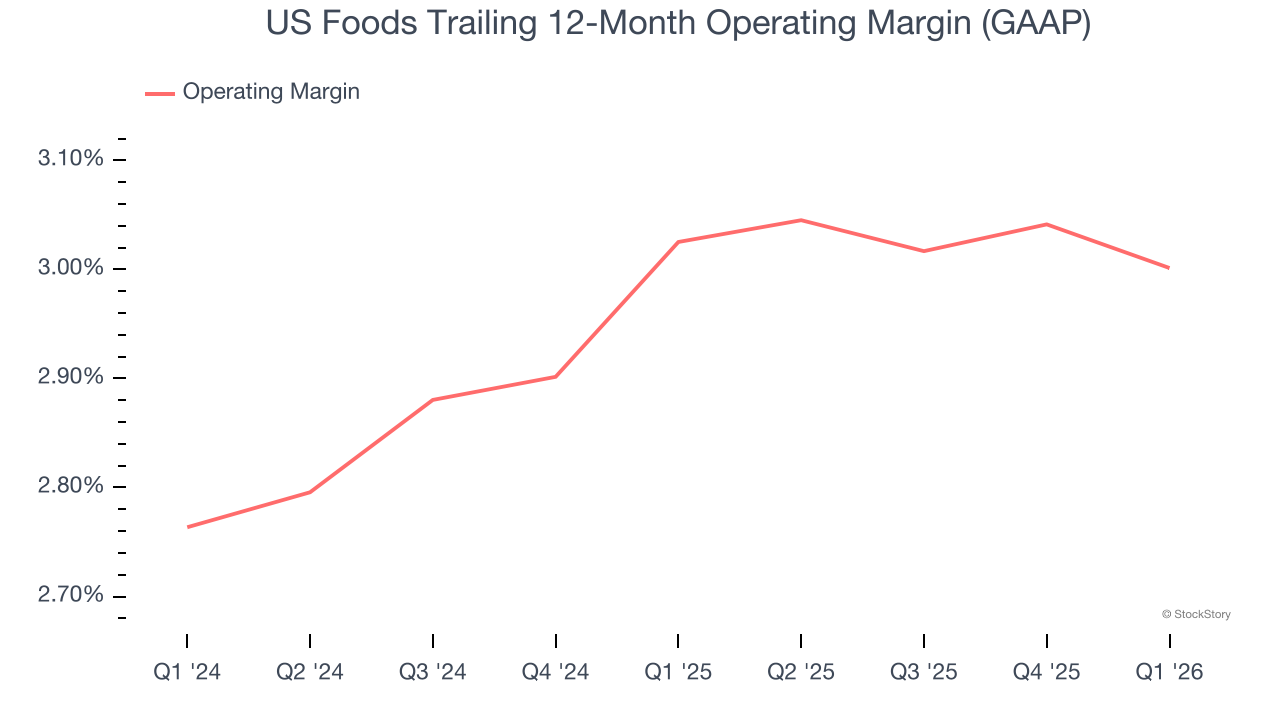
This quarter, US Foods generated an operating margin profit margin of 2.2%, in line with the same quarter last year. This indicates the company’s overall cost structure has been relatively stable.
Earnings Per Share
We track the long-term change in earnings per share (EPS) for the same reason as long-term revenue growth. Compared to revenue, however, EPS highlights whether a company’s growth is profitable.
US Foods’s EPS grew at 125% compounded annual growth rate over the last five years, higher than its 11.7% annualized revenue growth. This tells us the company became more profitable on a per-share basis as it expanded.
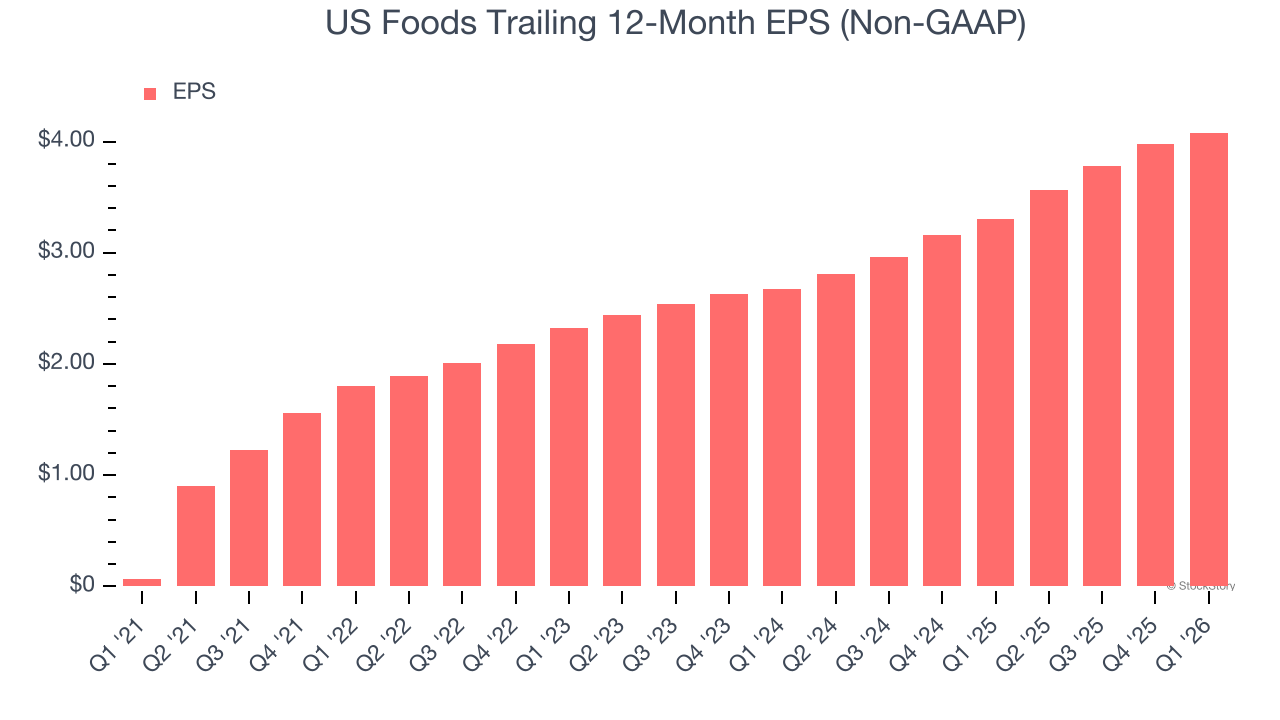
In Q1, US Foods reported adjusted EPS of $0.78, up from $0.68 in the same quarter last year. Despite growing year on year, this print missed analysts’ estimates, but we care more about long-term adjusted EPS growth than short-term movements. Over the next 12 months, Wall Street expects US Foods’s full-year EPS of $4.08 to grow 21.6%.
Key Takeaways from US Foods’s Q1 Results
We struggled to find many positives in these results. Its adjusted operating income missed and its EPS fell short of Wall Street’s estimates. Overall, this quarter could have been better. The stock traded down 2.6% to $89.66 immediately after reporting.
US Foods may have had a tough quarter, but does that actually create an opportunity to invest right now? When making that decision, it’s important to consider its valuation, business qualities, as well as what has happened in the latest quarter. We cover that in our actionable full research report which you can read here (it’s free).