What a time it’s been for Cracker Barrel. In the past six months alone, the company’s stock price has increased by a massive 49.5%, reaching $51.60 per share. This was partly thanks to its solid quarterly results, and the run-up might have investors contemplating their next move.
Is now the time to buy Cracker Barrel, or should you be careful about including it in your portfolio? Dive into our full research report to see our analyst team’s opinion, it’s free.
Why Do We Think Cracker Barrel Will Underperform?
We’re glad investors have benefited from the price increase, but we don’t have much confidence in Cracker Barrel. Here are three reasons we avoid CBRL, plus one stock we’d rather own.
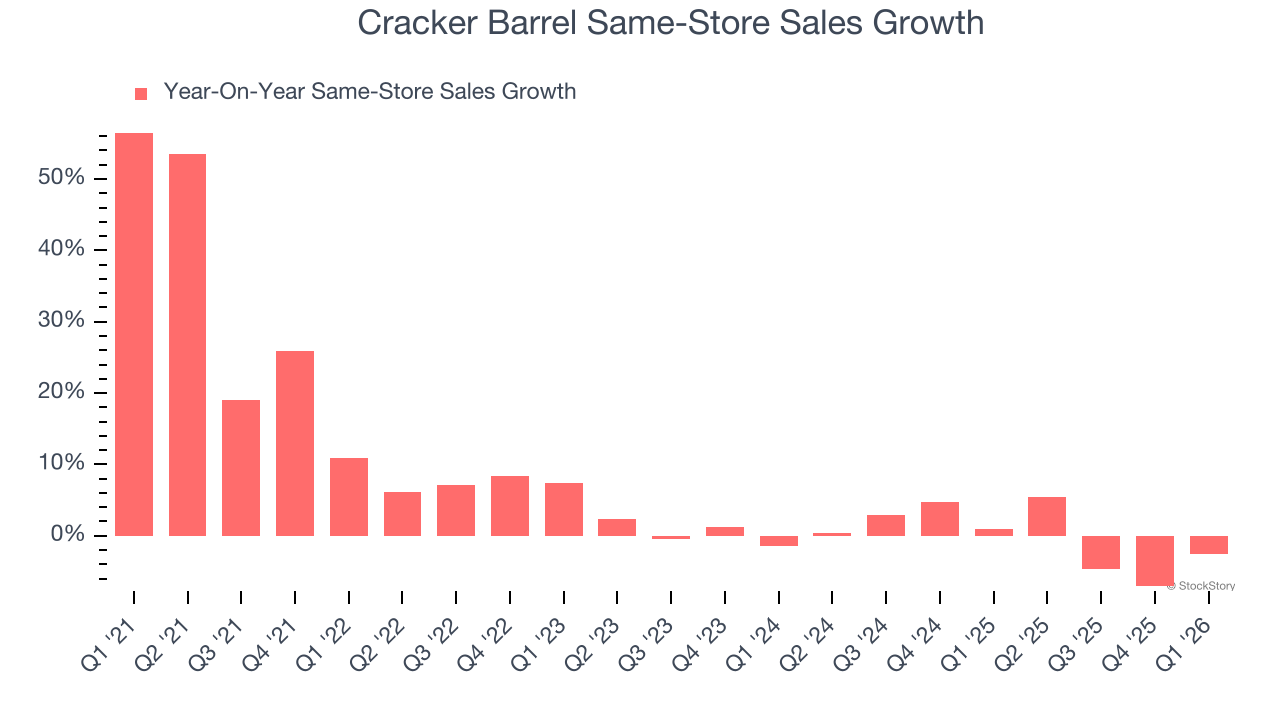
1. Flat Same-Store Sales Indicate Weak Demand
Same-store sales show the change in sales at restaurants open for at least a year. This is a key performance indicator because it measures organic growth.
Cracker Barrel’s demand within its existing dining locations has barely increased over the last two years as its same-store sales were flat.
2. EPS Trending Down
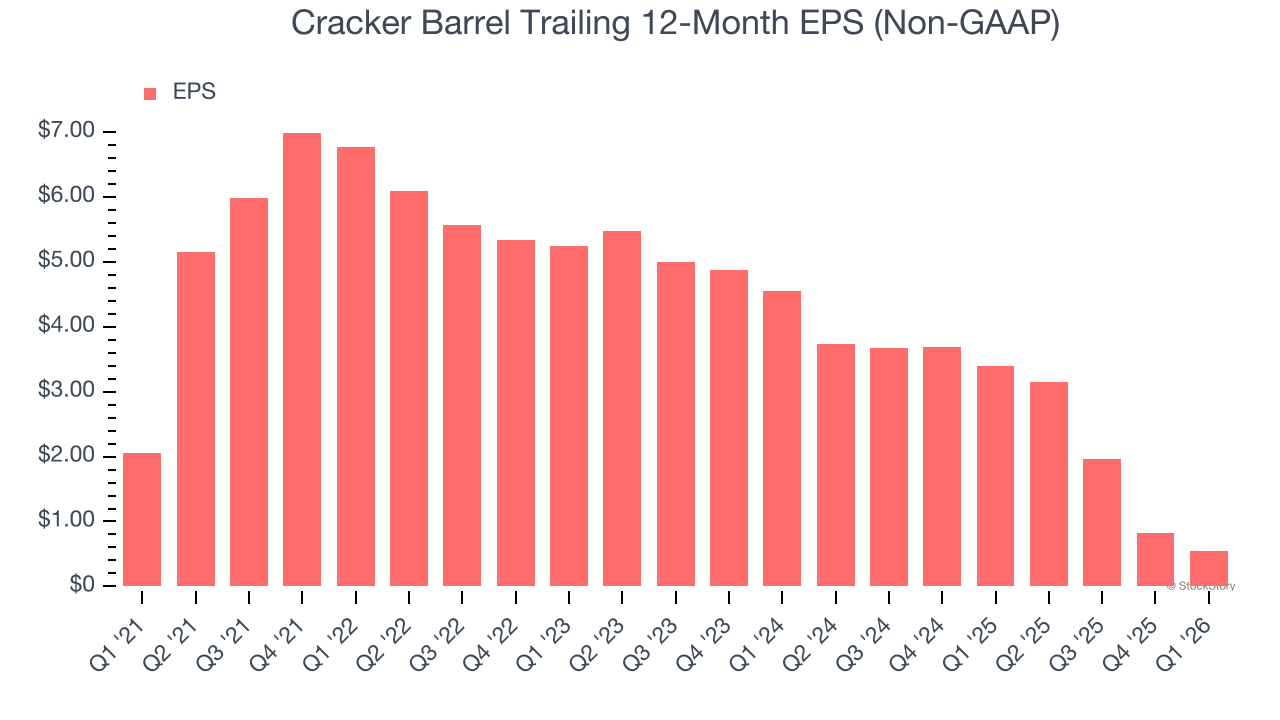
Analyzing the long-term change in earnings per share (EPS) shows whether a company’s incremental sales were profitable — for example, revenue could be inflated through excessive spending on advertising and promotions.
Sadly for Cracker Barrel, its EPS declined by 32.8% annually over the last seven years while its revenue grew by 1.1%. This tells us the company became less profitable on a per-share basis as it expanded.
3. High Debt Levels Increase Risk
Debt is a tool that can boost company returns but presents risks if used irresponsibly. As long-term investors, we aim to avoid companies taking excessive advantage of this instrument because it could lead to insolvency.
Cracker Barrel’s $998.3 million of debt exceeds the $26.05 million of cash on its balance sheet. Furthermore, its 7× net-debt-to-EBITDA ratio (based on its EBITDA of $141.4 million over the last 12 months) shows the company is overleveraged.
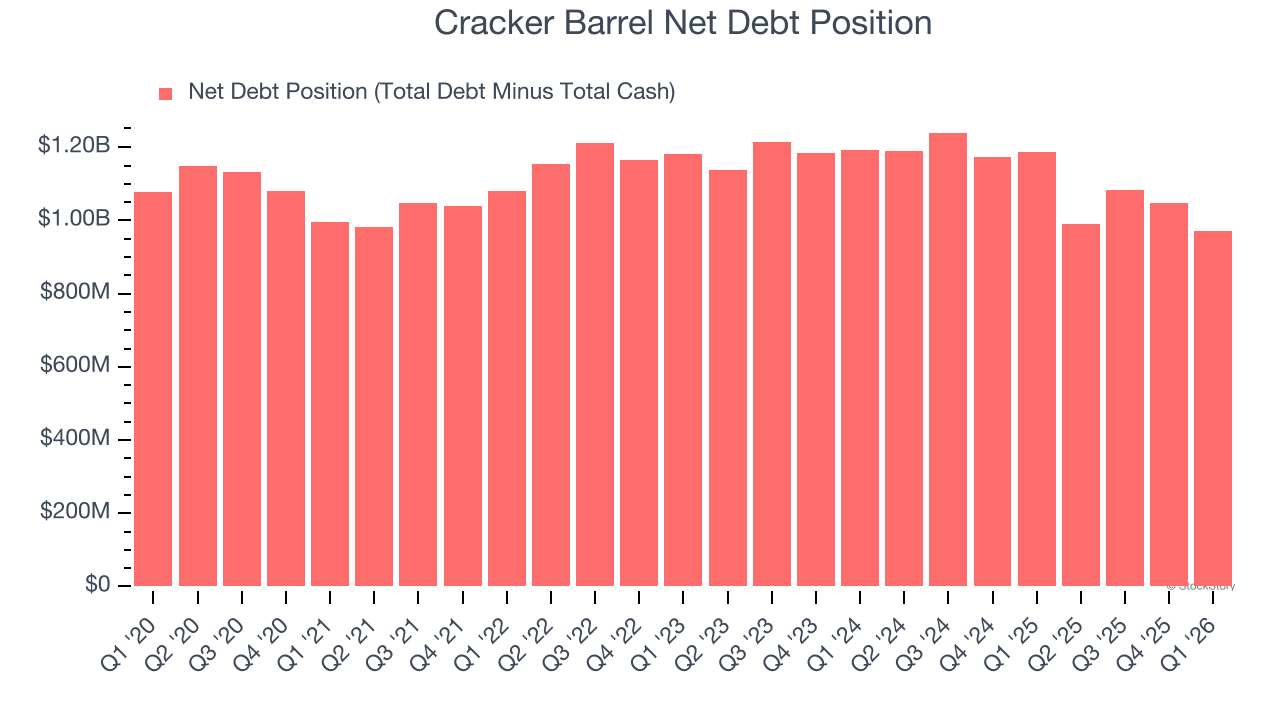
At this level of debt, incremental borrowing becomes increasingly expensive and credit agencies could downgrade the company’s rating if profitability falls. Cracker Barrel could also be backed into a corner if the market turns unexpectedly – a situation we seek to avoid as investors in high-quality companies.
We hope Cracker Barrel can improve its balance sheet and remain cautious until it increases its profitability or pays down its debt.
Final Judgment
Cracker Barrel doesn’t pass our quality test. Following the recent surge, the stock trades at 113.7× forward P/E (or $51.60 per share). This valuation tells us it’s a bit of a market darling with a lot of good news priced in - we think other companies feature superior fundamentals at the moment. Let us point you toward the most entrenched endpoint security platform on the market.
Stocks We Would Buy Instead of Cracker Barrel
WHILE YOU’RE HERE: Top 9 Market-Beating Stocks. The best stocks don’t just beat the market once. They do it again. And again. Robust revenue growth, rising free cash flow, returns on capital that leave their competition in the dust. The market has already rewarded these businesses.
But our AI platform says the party isn’t over. Find out which 9 stocks made the cut this week — FREE. Get Our Top 9 Market-Beating Stocks for Free HERE.
Stocks that have made our list include now familiar names such as Nvidia (+1,460% between June 2020 and June 2025) as well as under-the-radar businesses like the once-small-cap company Comfort Systems (+1,154% between June 2020 and June 2025). Find your next big winner with StockStory today.