Cash management services provider Brink's (NYSE: BCO) met Wall Street’s revenue expectations in Q2 CY2026, with sales up 7.1% year on year to $1.39 billion. On the other hand, next quarter’s revenue guidance of $1.39 billion was less impressive, coming in 0.9% below analysts’ estimates. Its non-GAAP profit of $2.13 per share was 4.4% above analysts’ consensus estimates.
Is now the time to buy Brink's? Find out by accessing our full research report, it’s free.
Brink's (BCO) Q2 CY2026 Highlights:
- Revenue: $1.39 billion vs analyst estimates of $1.39 billion (7.1% year-on-year growth, in line)
- Adjusted EPS: $2.13 vs analyst estimates of $2.04 (4.4% beat)
- Adjusted EBITDA: $237.5 million vs analyst estimates of $253.3 million (17.1% margin, 6.2% miss)
- Revenue Guidance for Q3 CY2026 is $1.39 billion at the midpoint, below analyst estimates of $1.4 billion
- Adjusted EPS guidance for Q3 CY2026 is $2.43 at the midpoint, above analyst estimates of $2.37
- EBITDA guidance for Q3 CY2026 is $273 million at the midpoint, in line with analyst expectations
- Operating Margin: 9.6%, down from 10.8% in the same quarter last year
- Free Cash Flow Margin: 0.1%, down from 11.7% in the same quarter last year
- Market Capitalization: $4.86 billion
Mark Eubanks, President and CEO, said: “Our strong second quarter shows continued progress against our AMS/DRS strategy with another quarter of mid-teens or better organic revenue growth. We closed several key customer wins late in the second and early in the third quarter that support continued growth momentum into the second half of the year. The margin accretion power of AMS/DRS is evident in our profitability with record second quarter operating profit and Adjusted EBITDA margin performance. Supported by underlying operational productivity and revenue mix benefits, Adjusted EBITDA margins expanded year-over-year in every segment in the second quarter. We continue to deliver sustainable improvements in cash generation with trailing-twelve-month free cash flow up $32 million dollars to $468 million reflecting conversion of 46 percent. Combined with NCR Atleos' strong second quarter results, released earlier this morning, both companies have now delivered first-half performance ahead of expectations. With increasing visibility into our second half performance and a favorable AMS/DRS growth trajectory, we remain confident in our financial outlook and our ability to fully realize the value creation potential of the acquisition."
Company Overview
Known for its iconic armored trucks that have been a fixture in American cities since 1859, Brink's (NYSE: BCO) provides secure transportation and management of cash and valuables for banks, retailers, and other businesses worldwide.
Revenue Growth
A company’s long-term sales performance can indicate its overall quality. Any business can put up a good quarter or two, but many enduring ones grow for years.
With $5.48 billion in revenue over the past 12 months, Brink's is one of the larger companies in the business services industry and benefits from a well-known brand that influences purchasing decisions.
As you can see below, Brink’s sales grew at a decent 6.4% compounded annual growth rate over the last five years. This shows its offerings generated slightly more demand than the average business services company, a helpful starting point for our analysis.
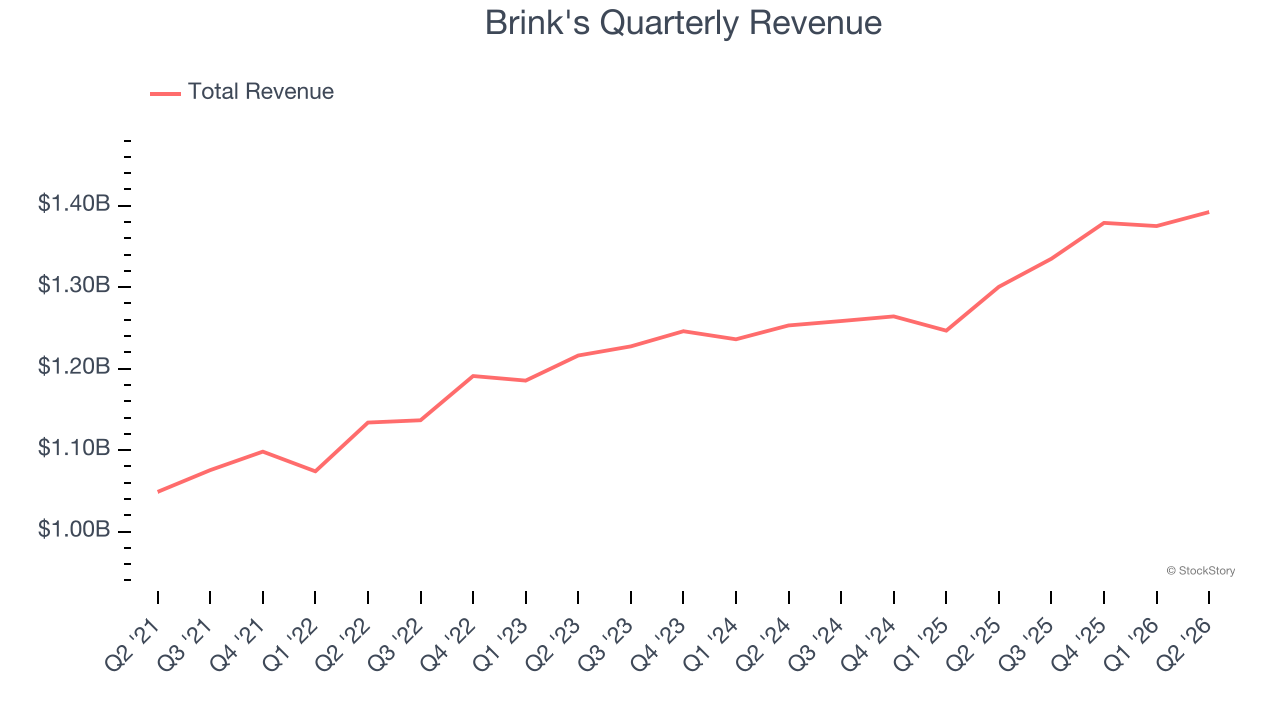
We at StockStory place the most emphasis on long-term growth, but within business services, a half-decade historical view may miss recent innovations or disruptive industry trends. Brink’s annualized revenue growth of 5.1% over the last two years is below its five-year trend, but we still think the results were respectable. 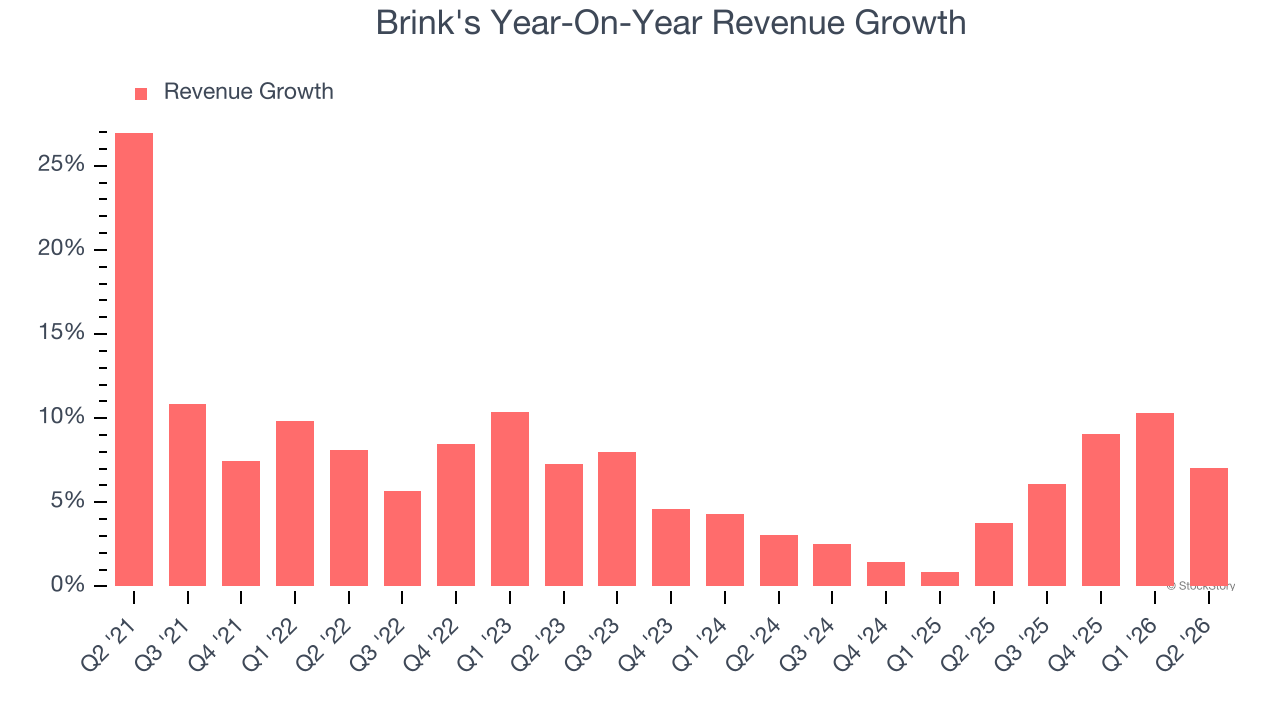
This quarter, Brink's grew its revenue by 7.1% year on year, and its $1.39 billion of revenue was in line with Wall Street’s estimates. Company management is currently guiding for a 4.1% year-on-year increase in sales next quarter.
Looking further ahead, sell-side analysts expect revenue to grow 3.5% over the next 12 months, a slight deceleration versus the last two years. This projection doesn’t excite us and indicates its products and services will face some demand challenges. At least the company is tracking well in other measures of financial health.
ALSO WORTH WATCHING: Nvidia’s Quiet Partner. Nvidia’s chips cost a hundred grand. The connectors that make them work cost even more. One company makes them all.
Every AI server needs specialized infrastructure the chip companies don’t make. High-speed cables. Power connectors. Thermal sensors. This 90-year-old company built a monopoly on it. The AI boom just started. This stock is still flying under the radar. Claim The Stock Ticker Here for FREE.
Adjusted Operating Margin
Brink's has managed its cost base well over the last five years. It demonstrated solid profitability for a business services business, producing an average adjusted operating margin of 12.5%.
Analyzing the trend in its profitability, Brink’s adjusted operating margin rose by 1.3 percentage points over the last five years, as its sales growth gave it operating leverage.
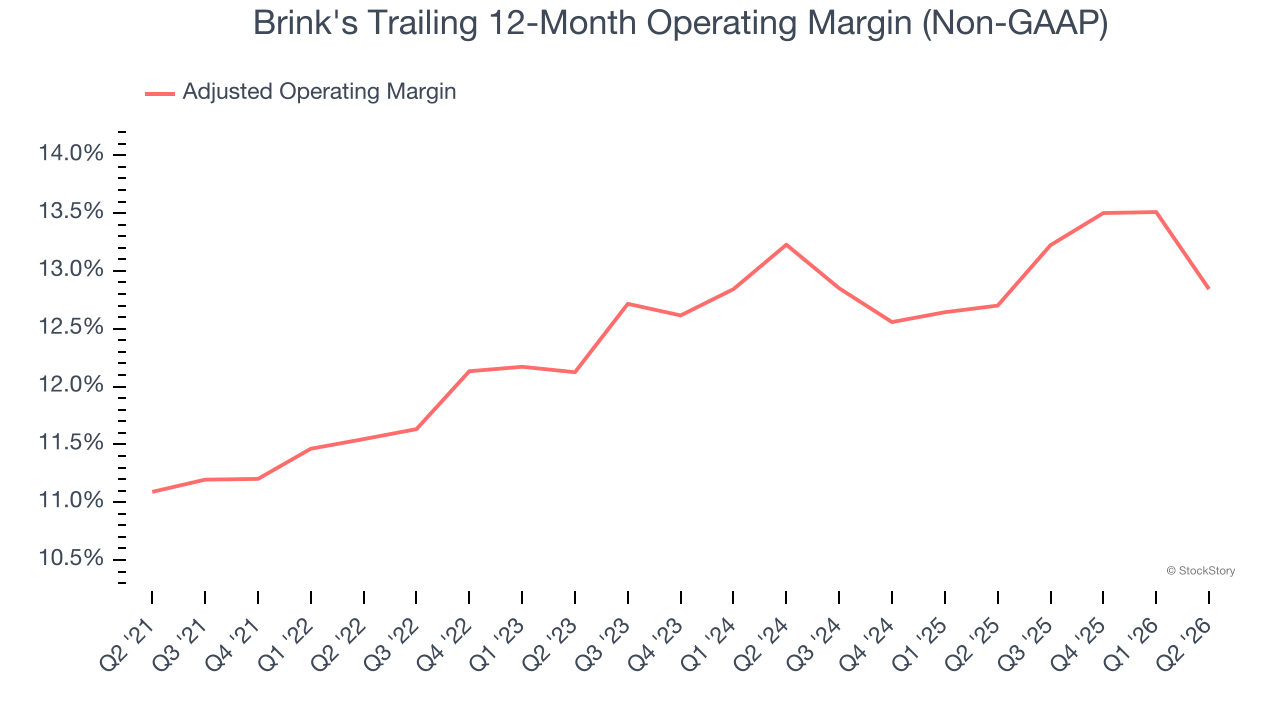
This quarter, Brink's generated an adjusted operating margin profit margin of 10.1%, down 2.6 percentage points year on year. This contraction shows it was less efficient because its expenses grew faster than its revenue.
Earnings Per Share
We track the long-term change in earnings per share (EPS) for the same reason as long-term revenue growth. Compared to revenue, however, EPS highlights whether a company’s growth is profitable.
Brink’s EPS grew at 13.7% compounded annual growth rate over the last five years, higher than its 6.4% annualized revenue growth. This tells us the company became more profitable on a per-share basis as it expanded.
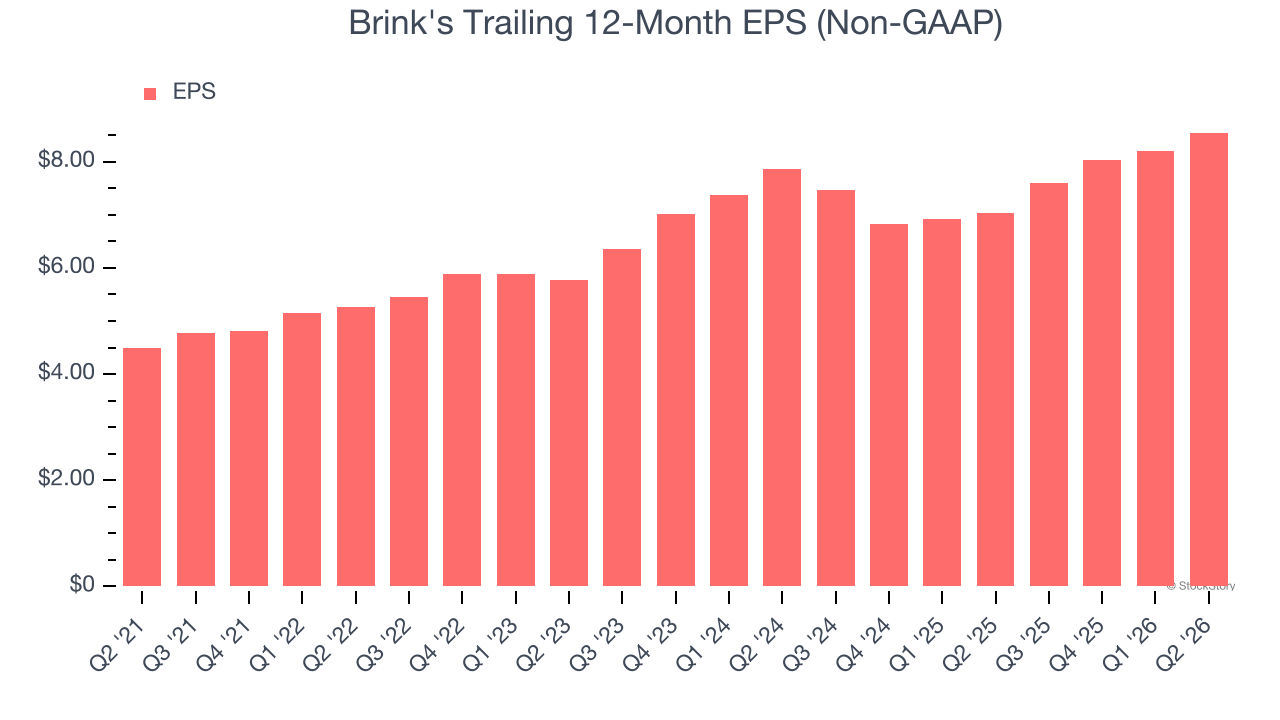
Diving into the nuances of Brink’s earnings can give us a better understanding of its performance. As we mentioned earlier, Brink’s adjusted operating margin declined this quarter but expanded by 1.3 percentage points over the last five years. Its share count also shrank by 40.6%, and these factors together are positive signs for shareholders because improving profitability and share buybacks turbocharge EPS growth relative to revenue growth. 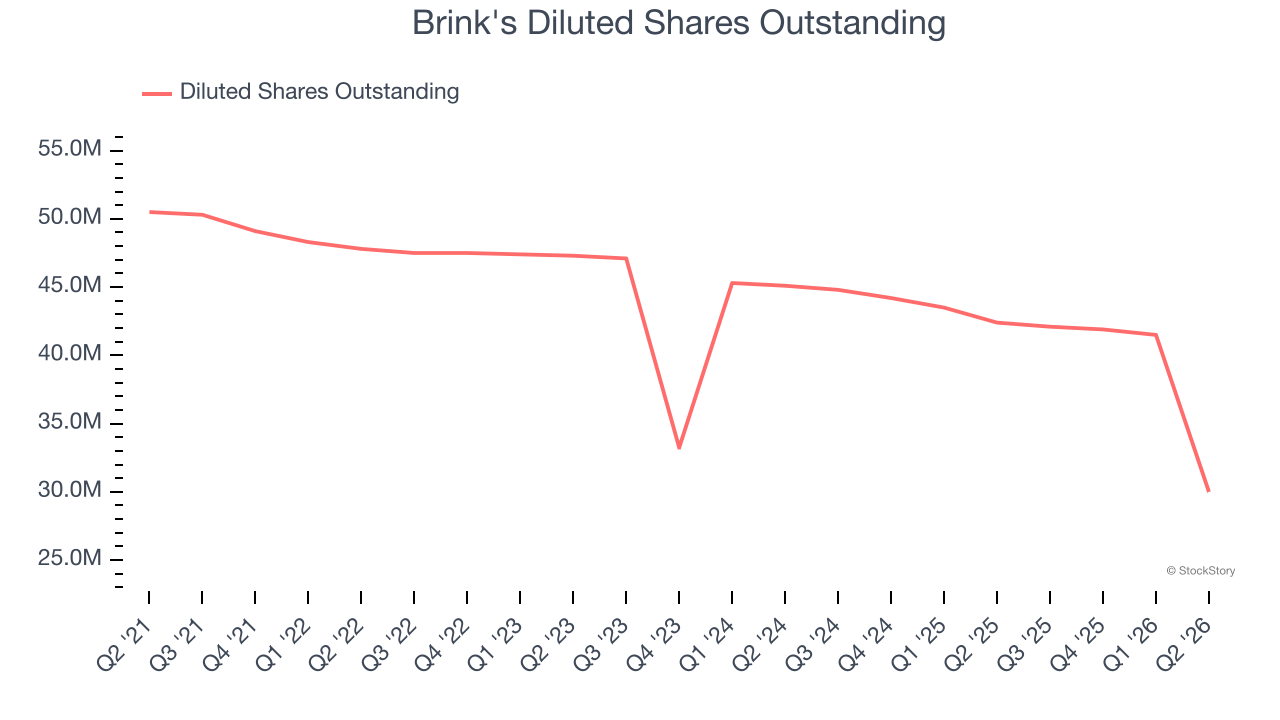
Like with revenue, we analyze EPS over a shorter period to see if we are missing a change in the business.
For Brink's, its two-year annual EPS growth of 4.2% was lower than its five-year trend. This wasn’t great, but at least the company was successful in other measures of financial health.
In Q2, Brink's reported adjusted EPS of $2.13, up from $1.79 in the same quarter last year. This print beat analysts’ estimates by 4.4%. Over the next 12 months, Wall Street expects Brink’s full-year EPS to grow 12.1% from $8.55 to $9.59.
Key Takeaways from Brink’s Q2 Results
We enjoyed seeing Brink's beat analysts’ EPS guidance for next quarter expectations this quarter. We were also glad its EPS outperformed Wall Street’s estimates. On the other hand, its revenue guidance for next quarter slightly missed. Overall, this print had some key positives. The stock traded up 2.9% to $121.40 immediately after reporting.
Should you buy the stock or not? The latest quarter does matter, but not nearly as much as longer-term fundamentals and valuation, when deciding if the stock is a buy. We cover that in our actionable full research report which you can read here (it’s free).