Recreational products manufacturer American Outdoor Brands (NASDAQ: AOUT) reported Q2 CY2026 results exceeding the market’s revenue expectations, with sales up 25.4% year on year to $37.25 million. The company expects the full year’s revenue to be around $205 million, close to analysts’ estimates. Its non-GAAP profit of $0.03 per share was significantly above analysts’ consensus estimates.
Is now the time to buy American Outdoor Brands? Find out by accessing our full research report, it’s free.
American Outdoor Brands (AOUT) Q2 CY2026 Highlights:
- Revenue: $37.25 million vs analyst estimates of $35.64 million (25.4% year-on-year growth, 4.5% beat)
- Adjusted EPS: $0.03 vs analyst estimates of -$0.24 (significant beat)
- Adjusted EBITDA: $1.16 million (3.1% margin, 137% year-on-year growth)
- The company reconfirmed its revenue guidance for the full year of $205 million at the midpoint
- EBITDA guidance for the full year is $16,000 at the midpoint, below analyst estimates of $13.59 million
- Operating Margin: -5.7%, up from -23% in the same quarter last year
- Free Cash Flow was $12.91 million, up from -$1.99 million in the same quarter last year
- Market Capitalization: $124.4 million
"More broadly, BUBBA® and Caldwell® demonstrate our strategy to build connected ecosystems around key growth brands that deepen consumer engagement and loyalty, extend the value of our innovation beyond individual products, and create multiple avenues for long-term growth. We believe this approach has the potential to extend to other brands in our portfolio over time."
Company Overview
Spun off from Smith and Wesson in 2020, American Outdoor Brands (NASDAQ: AOUT) is an outdoor and recreational products company that offers outdoor and shooting sports products but does not sell firearms themselves.
Revenue Growth
Examining a company’s long-term performance can provide clues about its quality. Any business can have short-term success, but a top-tier one grows for years. American Outdoor Brands struggled to consistently generate demand over the last five years as its sales dropped at a 7.1% annual rate. This was below our standards and is a sign of poor business quality.
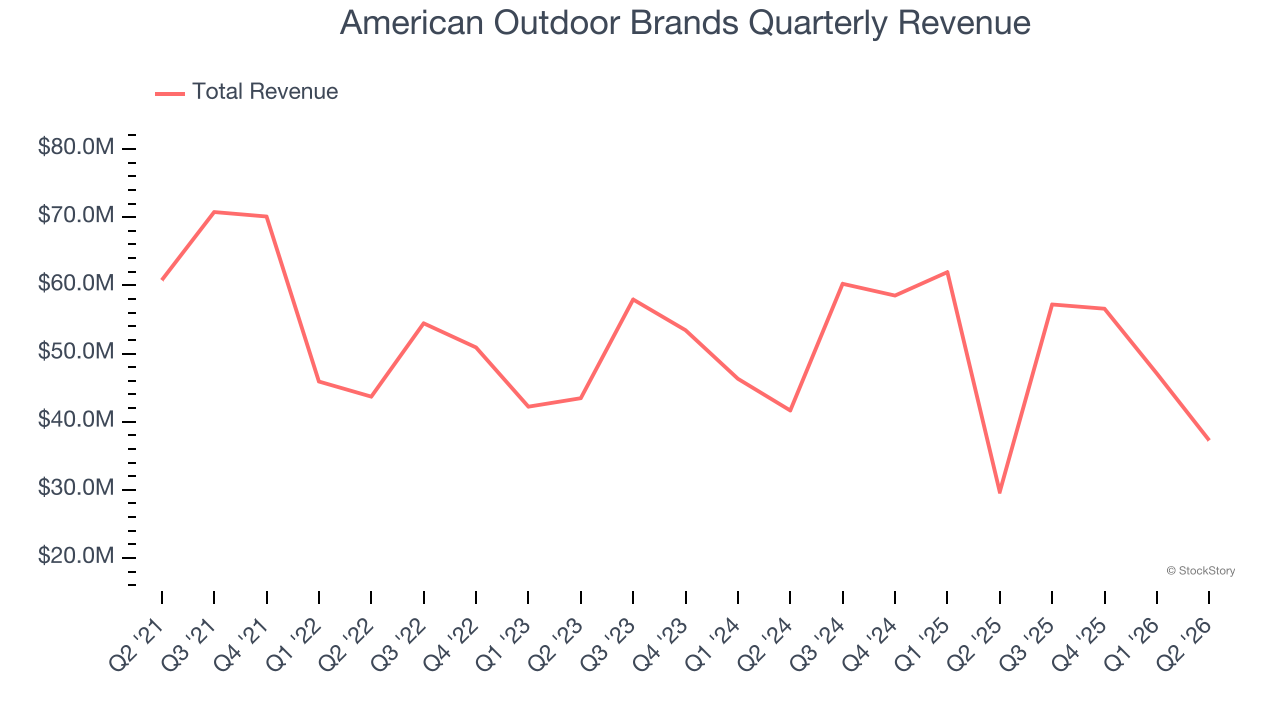
Long-term growth is the most important, but within consumer discretionary, product cycles are short and revenue can be hit-driven due to rapidly changing trends and consumer preferences. American Outdoor Brands’s revenue over the last two years was flat, suggesting its demand was weak but stabilized after its initial drop. 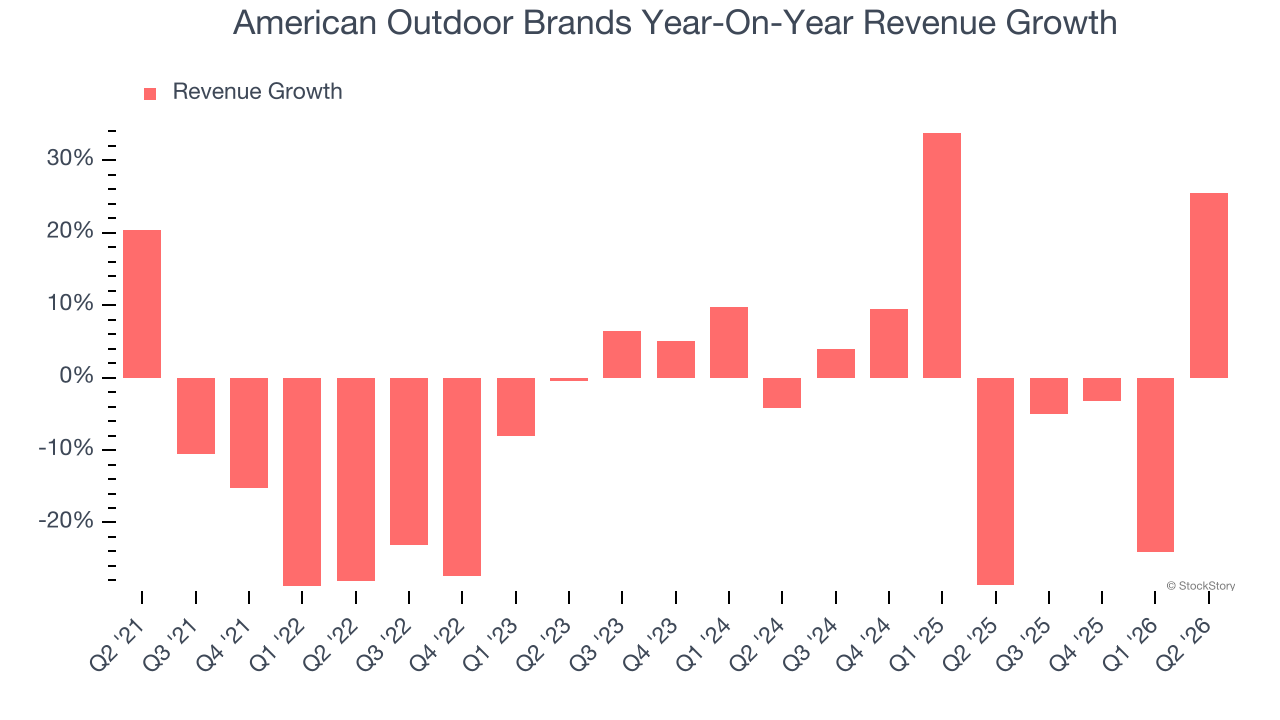
This quarter, American Outdoor Brands reported robust year-on-year revenue growth of 25.4%, and its $37.25 million of revenue topped Wall Street estimates by 4.5%.
Looking ahead, sell-side analysts expect revenue to grow 5.3% over the next 12 months. While this projection suggests its newer products and services will spur better top-line performance, it is still below average for the sector.
WHILE YOU’RE HERE: The Next Palantir? One satellite company captures images of every point on Earth. Every single day. The Pentagon wants it. Hedge funds are using it to beat earnings. You’ve probably never heard of it.
This is what the early days of Palantir looked like before it became a giant. Same playbook. Different technology. If you missed Palantir, you need to see this. Claim The Stock Ticker for Free HERE.
Operating Margin
Operating margin is a key measure of profitability. Think of it as net income - the bottom line - excluding the impact of taxes and interest on debt, which are less connected to business fundamentals.
American Outdoor Brands’s operating margin has risen over the last 12 months, but it still averaged negative 1.3% over the last two years. This is due to its large expense base and inefficient cost structure.
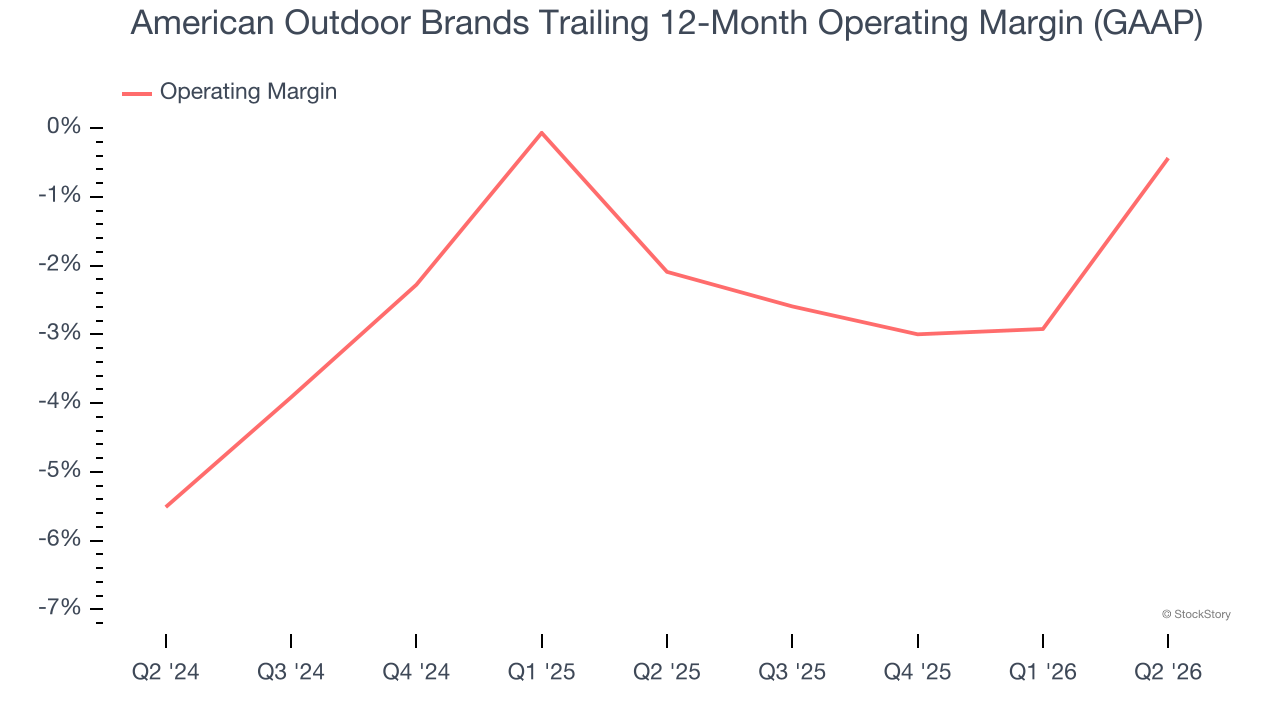
American Outdoor Brands’s operating margin was negative 5.7% this quarter. The company’s consistent lack of profits raises a flag.
Earnings Per Share
Revenue trends explain a company’s historical growth, but the long-term change in earnings per share (EPS) points to the profitability of that growth — for example, a company could inflate its sales through excessive spending on advertising and promotions.
Sadly for American Outdoor Brands, its EPS declined by 25.1% annually over the last five years, more than its revenue. This tells us the company struggled because its fixed cost base made it difficult to adjust to shrinking demand.
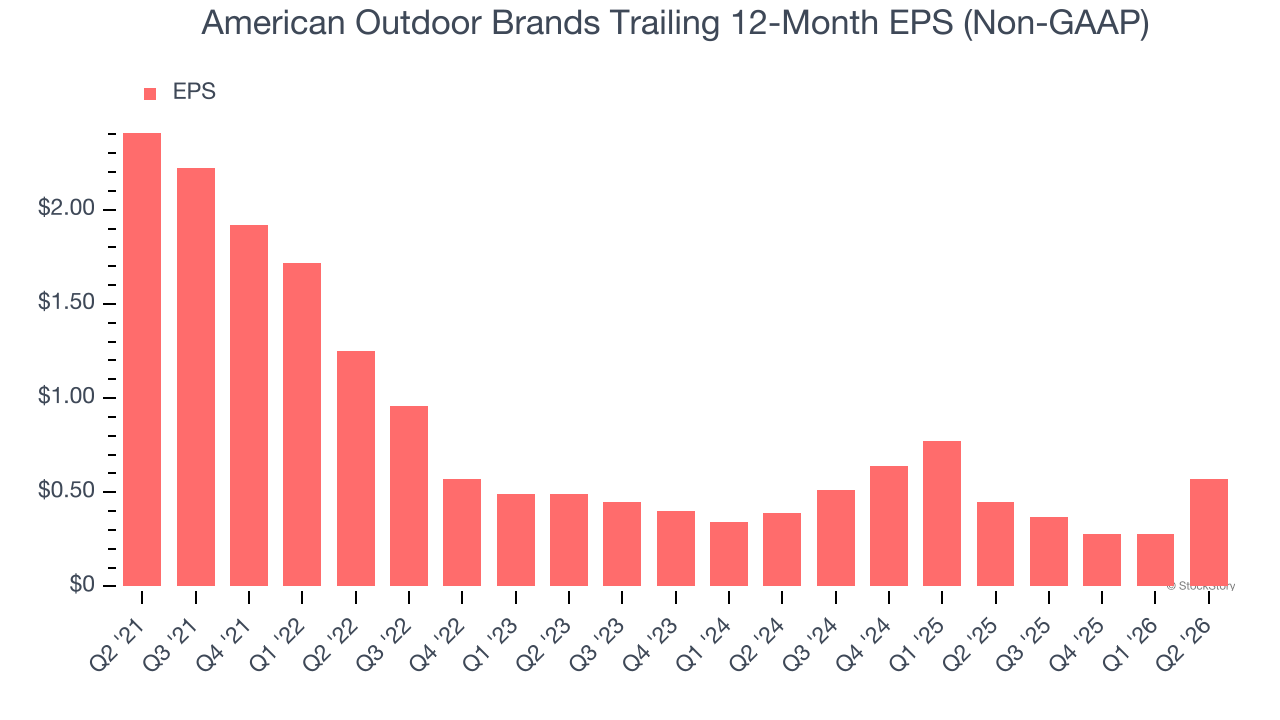
In Q2, American Outdoor Brands reported adjusted EPS of $0.03, up from negative $0.26 in the same quarter last year. This print easily cleared analysts’ estimates, and shareholders should be content with the results. We also like to analyze expected EPS growth based on Wall Street analysts’ consensus projections, but there is insufficient data.
Key Takeaways from American Outdoor Brands’s Q2 Results
It was good to see American Outdoor Brands beat analysts’ EPS expectations this quarter. We were also excited its EBITDA outperformed Wall Street’s estimates by a wide margin. On the other hand, its full-year EBITDA guidance missed. Overall, this print had some key positives. The stock traded up 14.6% to $11.47 immediately after reporting.
Should you buy the stock or not? When making that decision, it’s important to consider its valuation, business qualities, as well as what has happened in the latest quarter. We cover that in our actionable full research report which you can read here (it’s free).