TORONTO, ON / ACCESSWIRE / February 8, 2024 / Signal Gold Inc. ("Signal Gold" or the "Company") (TSX:SGNL)(OTCQX:SGNLF) is pleased to announce the final diamond drill results from the Company's growth exploration program at the Goldboro Project in Nova Scotia ("Goldboro", or the "Project"). The remaining diamond drill results are from 3,813 metres of drilling in 19 diamond drill holes that targeted near surface gold mineralization west of the Goldboro Mineral Resource and immediately to the east of the past producing Dolliver Mountain Gold Mine* ("Dolliver Mountain") (Exhibit A). The results included thirteen (13) instances of visible gold and 74 separate intersections of gold mineralization (Exhibits B and C), all located within the same anticline which hosts the Goldboro Deposit. These drill results are part of the larger growth exploration program in 2023 which comprised 11,435 metres in 61 diamond drill holes, focused on the discovery of gold mineralization to the west and along strike of the Goldboro Mineral Resource.
"We are excited to announce these final drill results which, together with those previously released, conclusively demonstrate continuous gold mineralization along a strike length of 1.1 kilometres between the western extent of the Goldboro Deposit and the past producing Dolliver Mountain Mine, bringing the total strike length of known mineralization to 3.4 kilometres. This provides further confidence in the scalability of the Goldboro Deposit as well as in our exploration model and approach to gold discovery, which can be applied to 51 kilometres of strike extent along the combined Goldboro and Lower Seal Harbour trends. Our expanded and prospective land package of 27,200 hectares provides the opportunity to make additional discoveries in the Goldboro Gold District and to leverage the planned mine and mill infrastructure at Goldboro."
~ Kevin Bullock, President and CEO, Signal Gold Inc.
Selected composited highlights (core length) from the current drill holes include:
- 76.31 g/t gold over 0.5 metres (111.0 to 111.5 metres) in hole BR-23-436;
- 12.88 g/t gold over 0.6 metres (157.4 to 158 metes) in hole BR-23-439;
- 7.73 g/t gold over 1.0 metres (17.6 to 18.6 metres) in hole BR-23-438;
- 2.10 g/t gold over 3.8 metres (140.1 to 143.9 metres) in hole BR-23-437, including 4.67 g/t gold over 1.0 metres; and
- 1.33 g/t gold over 3.0 metres (177.0 to 180.0 metres) in hole BR-23-433 including 2.75 g/t gold over 0.6 metres
The drill results from these 19 diamond drill holes (BR-23-415, 418, 420, 422 to 426, 429 to 439) further demonstrate that the geological environment at Dolliver Mountain is similar to the Goldboro Deposit, with gold mineralization associated with multiple stacked argillite and quartz vein zones typically containing pyrite and arsenopyrite. This system is folded into the upright Upper Seal Harbour Anticline and plunges gently to the east (approximately 200). It is the occurrence of pyrite and arsenopyrite associated with the alteration assemblage and gold mineralization that produces the Induced Polarization chargeability anomalies that were targeted during the growth exploration program.
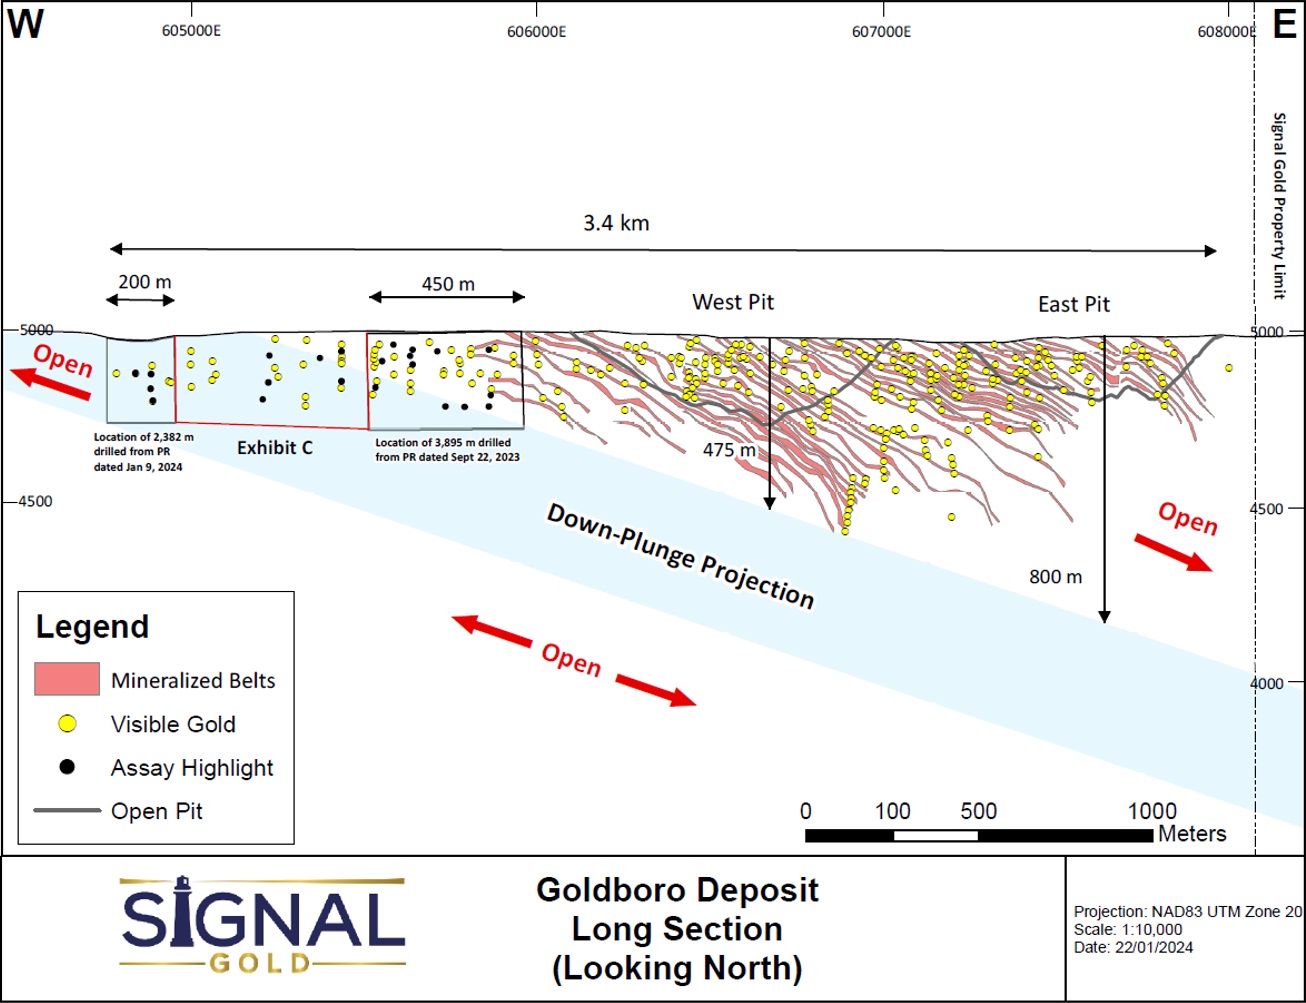
Drilling tested the host anticline to a vertical depth of 230 metres, and mineralization continues to be open to the west and at depth. Importantly, the intersection of gold mineralization at Dolliver Mountain also highlights the potential for further discovery of gold down-plunge and beneath the currently defined Goldboro Deposit below 550 vertical metres, presently the deepest drilling to date. (Exhibit D).
*Operations began at the Dolliver Mountain Gold Mine in 1901 and the operation ceased in 1904.

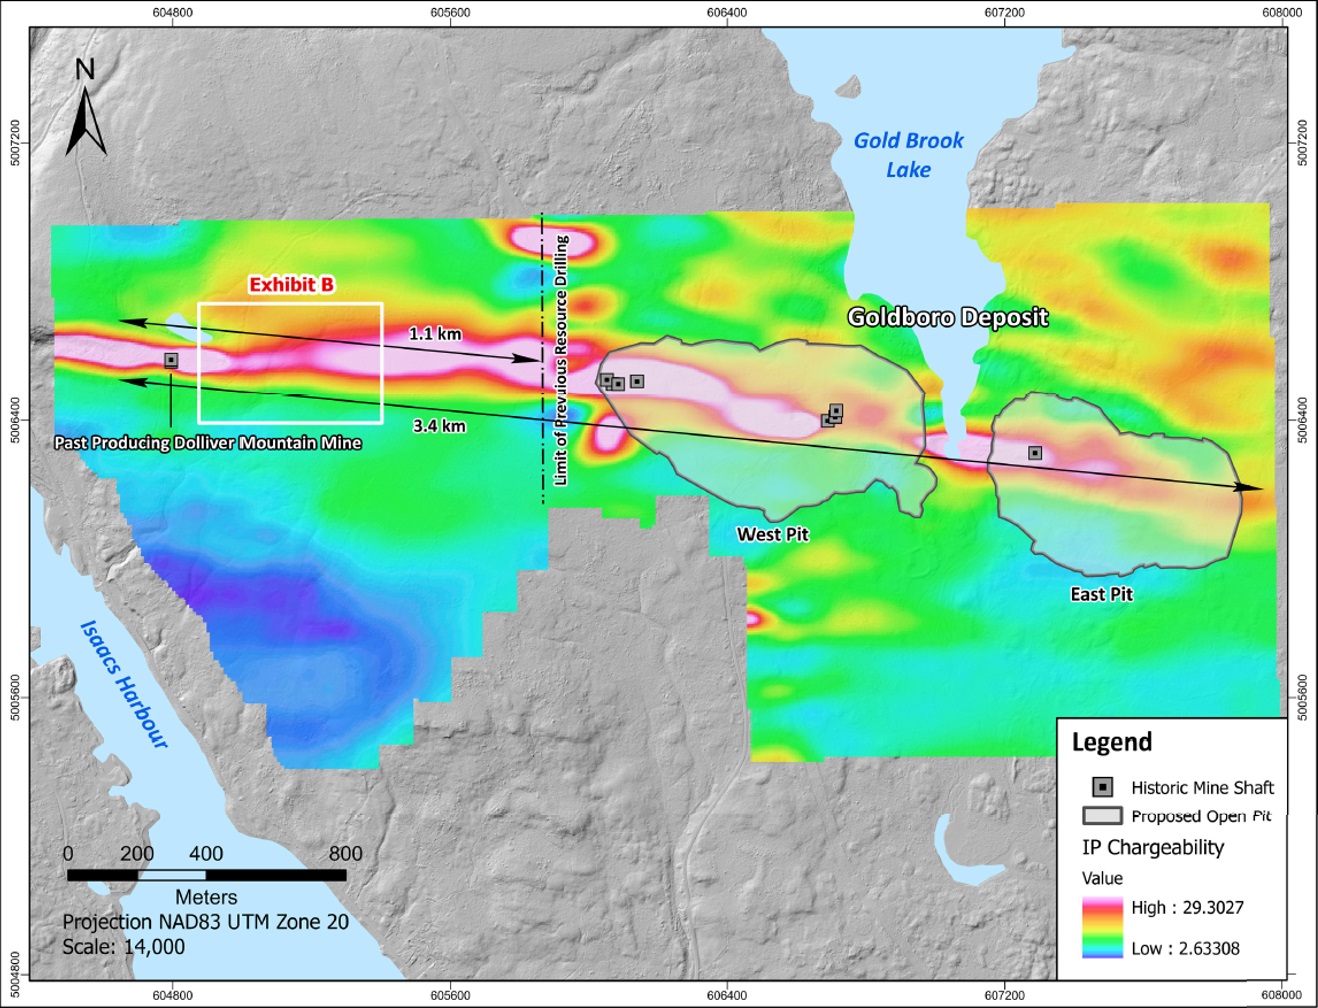
Exhibit A. A map showing the location of the conceptual West and East pits of the Goldboro Project and the location of the past producing Dolliver Mountain Gold Mine to the west. Also shown is the trend of the host structure to the Goldboro Deposit and its demonstrated westerly extension as shown by a recently completed Induced Polarization ("IP") Geophysical survey.

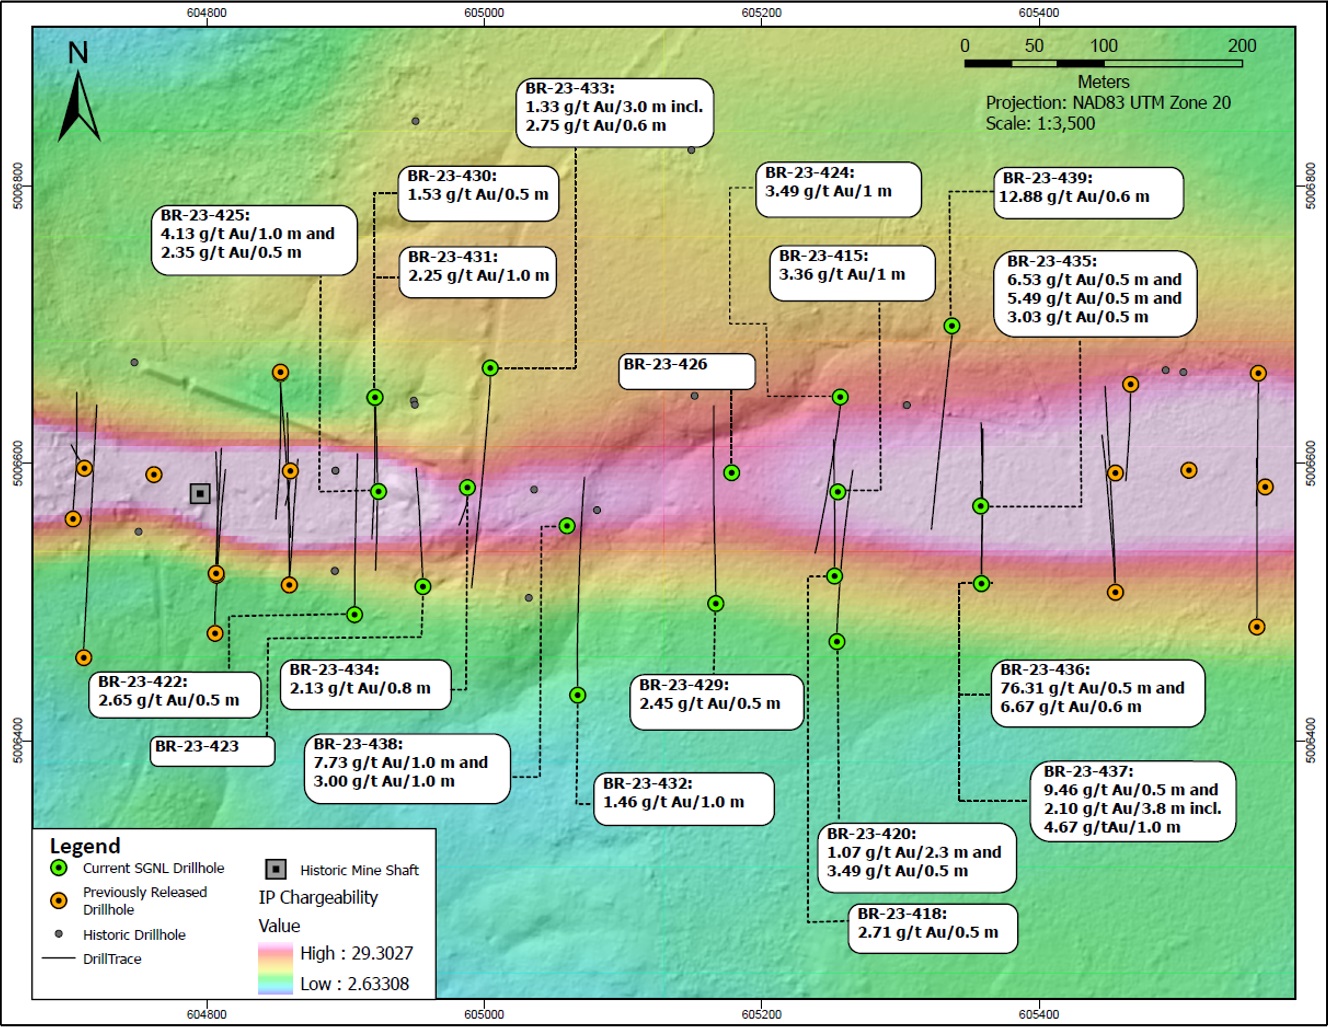
Exhibit B. A plan map showing the location of drill holes BR-23-415, 418, 420, 422-426, 429-439, over a 450 metres strike east of the past-producing Dolliver Mountain Mine.

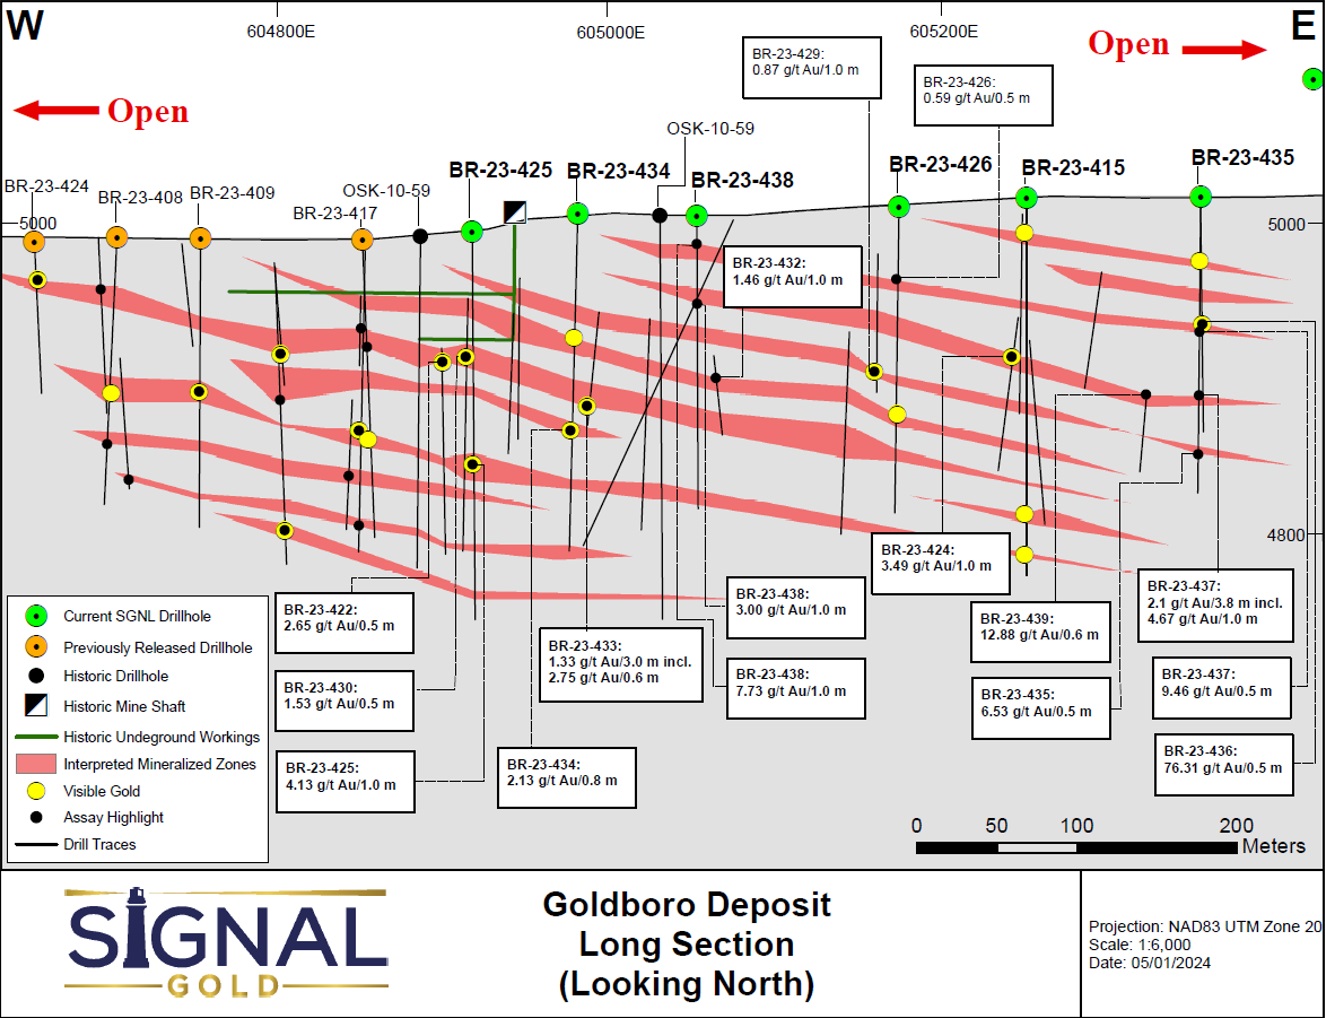
Exhibit C. A vertical longitudinal section through the west end of the Goldboro Deposit and including the area of the recent drill program. The drill program demonstrates that the structure that hosts the Goldboro Deposit and the same style of alteration and mineralization exist west of previous drill sections showing that the Deposit has the potential to be expanded westward. Potential mineralized belts are shown as currently interpreted.

Exhibit D. A schematic vertical longitudinal section, looking north, showing the 3.4-kilometre strike of known gold mineralization between and inclusive of Dolliver Mountain and the Goldboro Deposit. The drill results from Dolliver Mountain are significant in that they demonstrate potential for discovery of additional gold mineralization down-plunge to the east beneath the current defined Goldboro Deposit.
A table of selected composited assay results from the drill program
| Drillhole | From (m) | To (m) | Interval (m) | Gold (g/t) | Visible Gold |
| BR-23-415 | 154.9 |
155.6 |
0.7 |
0.60 |
|
and |
171.0 |
171.5 |
0.5 |
1.16 |
|
and |
178.6 |
179.1 |
0.5 |
2.85 |
|
and |
189.7 |
190.7 |
1.0 |
3.36 |
VG |
and |
212.0 |
214.1 |
2.1 |
0.92 |
VG |
incl. |
213.1 |
216.6 |
0.5 |
2.82 |
|
| BR-23-418 | 31.5 |
32.0 |
0.5 |
2.71 |
|
and |
150.1 |
151.1 |
1.0 |
0.57 |
|
| BR-23-420 | 78.0 |
78.5 |
0.5 |
0.97 |
|
and |
83.0 |
84.0 |
1.0 |
0.90 |
|
and |
90.9 |
91.9 |
1.0 |
1.77 |
|
and |
113.2 |
114.2 |
1.0 |
0.84 |
|
and |
119.4 |
120.0 |
0.6 |
0.80 |
|
and |
114.1 |
144.6 |
0.5 |
3.49 |
|
and |
173.5 |
174.0 |
0.5 |
0.80 |
|
and |
214.1 |
216.4 |
2.3 |
1.07 |
|
| BR-23-422 | 71.0 |
72.0 |
1.0 |
0.67 |
VG |
and |
82.2 |
82.7 |
0.5 |
2.65 |
VG |
and |
126.8 |
127.8 |
1.0 |
0.96 |
|
and |
211.9 |
212.4 |
0.5 |
0.69 |
|
| BR-23-423 | 46.2 |
46.7 |
0.5 |
0.85 |
|
| BR-23-424 | 114.0 |
115.0 |
1.0 |
3.49 |
VG |
| BR-23-425 | 47.8 |
48.8 |
1.0 |
3.06 |
|
and |
71.1 |
72.8 |
1.7 |
1.13 |
|
and |
94.0 |
94.5 |
0.5 |
0.66 |
|
and |
136.3 |
136.8 |
0.5 |
2.35 |
|
and |
139.9 |
140.9 |
1.0 |
4.13 |
VG |
and |
147.5 |
148.5 |
1.0 |
0.52 |
|
and |
216.0 |
216.9 |
0.9 |
1.39 |
|
| BR-23-426 | 44.4 |
44.9 |
0.5 |
0.59 |
|
| BR-23-429 | 93.0 |
93.5 |
0.5 |
1.36 |
|
and |
97.4 |
98.4 |
1.0 |
0.60 |
|
and |
134.0 |
135.0 |
1.0 |
0.87 |
VG |
and |
136.9 |
137.5 |
0.6 |
0.72 |
|
and |
173.0 |
173.5 |
0.5 |
2.45 |
|
| BR-23-430 | 61.3 |
61.8 |
0.5 |
1.53 |
VG |
and |
103.6 |
104.6 |
1.0 |
0.51 |
|
| BR-23-431 | 36.2 |
37.2 |
1.0 |
2.25 |
|
and |
156.9 |
157.9 |
0.7 |
0.52 |
|
and |
178.0 |
178.5 |
0.5 |
0.73 |
|
| BR-23-432 | 44.9 |
45.4 |
0.5 |
1.93 |
|
and |
144.4 |
145.4 |
1.0 |
1.46 |
|
and |
190.0 |
190.5 |
0.5 |
0.97 |
|
and |
194.7 |
195.3 |
0.6 |
0.60 |
|
| BR-23-433 | 47.4 |
48.0 |
0.6 |
0.99 |
|
and |
93.0 |
94.0 |
1.0 |
0.91 |
|
and |
177.0 |
180.0 |
3.0 |
1.33 |
VG |
incl. |
179.4 |
180.0 |
0.6 |
2.75 |
|
| BR-23-434 | 102.4 |
103.5 |
1.1 |
1.60 |
|
and |
131.6 |
132.4 |
0.8 |
2.13 |
VG |
and |
200.9 |
201.5 |
0.6 |
1.78 |
|
| BR-23-435 | 62.0 |
62.5 |
0.5 |
5.49 |
|
and |
123.1 |
124.6 |
1.5 |
1.53 |
|
incl. |
123.1 |
123.6 |
0.5 |
3.03 |
|
and |
154.7 |
155.2 |
0.5 |
6.53 |
|
| BR-23-436 | 35.3 |
35.8 |
0.5 |
0.69 |
|
and |
36.8 |
37.4 |
0.6 |
0.51 |
|
and |
41.5 |
42.0 |
0.5 |
1.03 |
|
and |
96.6 |
97.2 |
0.6 |
1.76 |
|
and |
111.0 |
111.5 |
0.5 |
76.31 |
VG |
and |
129.0 |
129.5 |
0.5 |
0.57 |
|
and |
135.6 |
136.2 |
0.6 |
6.97 |
VG |
| BR-23-437 | 84.1 |
84.6 |
0.5 |
2.09 |
|
and |
89.1 |
89.6 |
0.5 |
9.46 |
|
and |
95.1 |
95.6 |
0.5 |
0.54 |
|
and |
96.1 |
96.8 |
0.7 |
0.62 |
|
and |
140.1 |
143.9 |
3.8 |
2.10 |
|
incl. |
140.1 |
141.4 |
1.0 |
4.67 |
|
and |
193.9 |
194.9 |
1.0 |
0.77 |
VG |
| BR-23-438 | 17.6 |
18.6 |
1.0 |
7.73 |
|
and |
21.2 |
22.2 |
1.0 |
1.13 |
|
and |
54.5 |
55.5 |
1.0 |
3.00 |
|
and |
57.4 |
58.4 |
1.0 |
0.86 |
|
| BR-23-439 | 157.4 |
158.0 |
0.6 |
12.88 |
Footnotes:
- Intervals are reported as core length only. True widths are estimated to be between 70% and 100% of the core length.
- All drill hole results are reported using fire assay only. See notes on QAQC procedures at the bottom of this press release.
- Drill holes were oriented along a north-south trend with holes on the north limb of the hosting anticlinal structure drilled southward and holes located south of the anticlinal structure drilled northward. The dip of holes is dependent upon the location relative to the anticline with the goal of intersecting mineralized zones orthogonally.
All samples and the resultant composites referred to in this release are collected using QA/QC protocols including the regular insertion of standards and blanks within the sample batch for analysis and check assays of select samples. All samples quoted in this release were analyzed at Eastern Analytical Ltd. in Springdale, NL, for Au by fire assay (30 g) with an AA finish.
All assays in this press release are reported as fire assays only. For samples analyzing greater than 0.5 g/t Au via 30 g fire assay, these samples will be re-analyzed at Eastern Analytical Ltd. via total pulp metallics. For the total pulp metallics analysis, the entire sample is crushed to -10mesh and pulverized to 95% -150mesh. The total sample is then weighed and screened to 150mesh. The +150mesh fraction is fire assayed for Au, and a 30 g subsample of the -150mesh fraction analyzed via fire assay. A weighted average gold grade is calculated for the final reportable gold grade. Total pulp metallics assays for drill holes sited within this press release may be updated in a future news release.
This news release has been reviewed and approved by Paul McNeill, P.Geo., VP Exploration with Signal Gold Inc., a "Qualified Person", under National Instrument 43-101 Standard for Disclosure for Mineral Projects.
ABOUT SIGNAL GOLD
Signal Gold is advancing the Goldboro Gold Project in Nova Scotia, a significant growth project subject to a positive Feasibility Study which demonstrates an approximately 11-year open pit life of mine ("LOM") with average gold production of 100,000 ounces per annum and an average diluted grade of 2.26 grams per tonne gold. (Please see the ‘NI 43-101 Technical Report and Feasibility Study for the Goldboro Gold Project, Eastern Goldfields District, Nova Scotia' on January 11, 2022, for further details). On August 3, 2022, the Goldboro Project received its environmental assessment approval from the Nova Scotia Minister of Environment and Climate Change, a significant regulatory milestone, and the Company has now submitted all key permits including the Industrial Approval, Fisheries Act Authorization and Schedule II Amendment, and the Mining and Crown Land Leases. The Goldboro Project has significant potential for further Mineral Resource expansion, particularly towards the west along strike and at depth, and the Company has consolidated 27,200 hectares (~272 km2) of prospective exploration land in the Goldboro Gold District.
FOR ADDITIONAL INFORMATION CONTACT:
|
Signal Gold Inc. Kevin Bullock President and CEO (647) 388-1842 kbullock@signalgold.com |
Reseau ProMarket Inc. Dany Cenac Robert Investor Relations (514) 722-2276 x456 Dany.Cenac-Robert@ReseauProMarket.com |
SOURCE: Signal Gold Inc.
View the original press release on accesswire.com


