Spotting market trends is easy in hindsight. But what if you could identify them as they happen?
That’s exactly what Barchart’s Trend Seeker® was built to do.
In a recent webinar, John Rowland, Senior Market Strategist at Barchart, explains how the Trend Seeker indicator uses price action, wave theory, and volatility to pinpoint bullish, bearish, and neutral trends — all displayed directly on your chart with easy-to-read colored dots.
What is Trend Seeker?
Barchart’s Trend Seeker is a computerized trend analysis system that combines:
- Wave theory to identify market cycles
- Momentum to confirm direction
- Volatility filters to detect trend shifts early
It’s designed to do two things exceptionally well:
- Cut losing trades early
- Let winning trades run longer
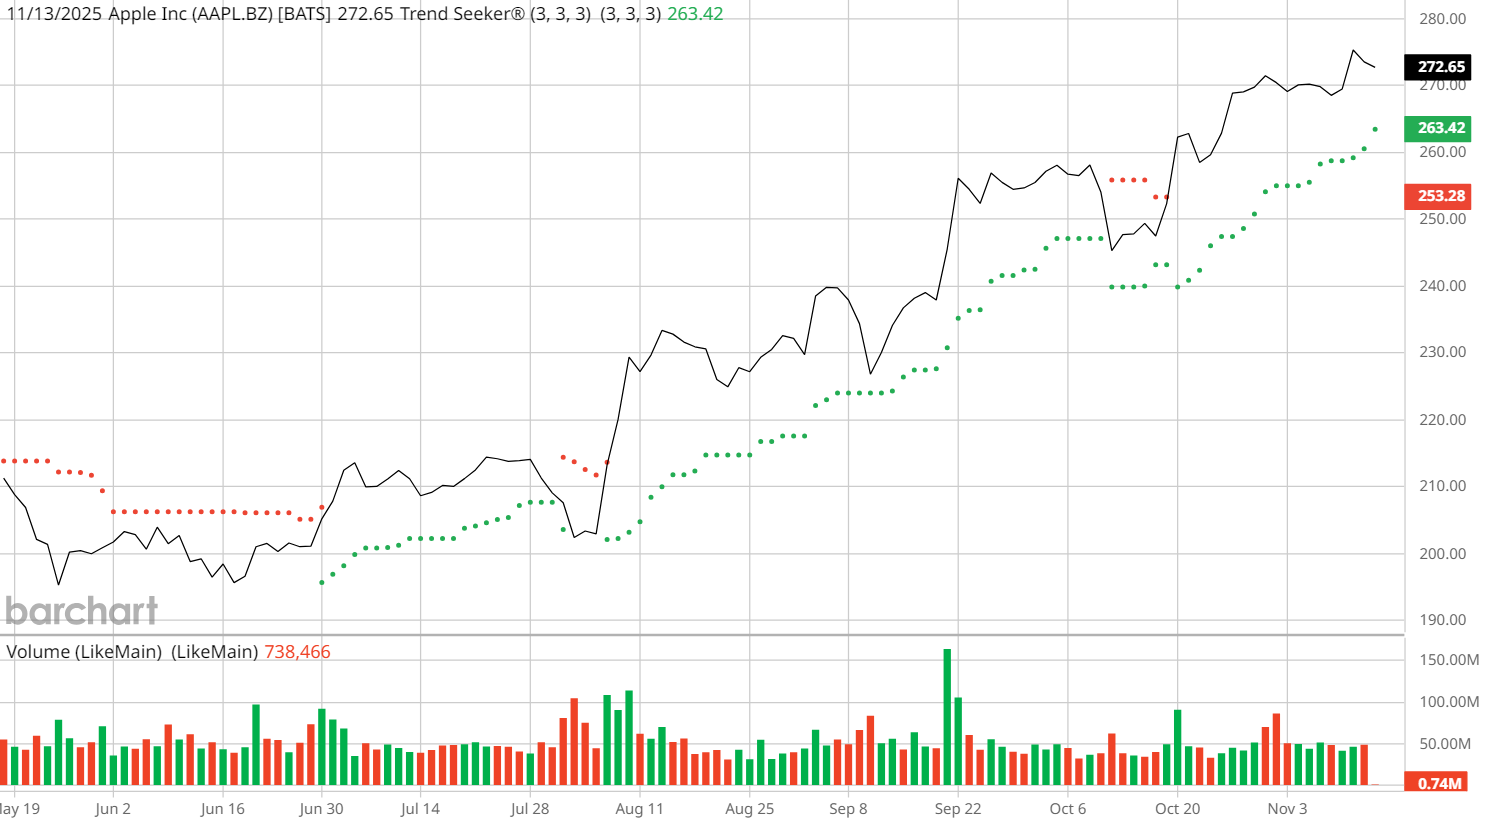
Each dot on the chart tells you what phase the market is in:
🟢 Green dots below price: Bullish trend (support forming)
🔴 Red dots above price: Bearish trend (resistance forming)
⚪ Two dots (one above, one below): Neutral or “hold” zone — the system is waiting for a new trend confirmation
When a trend ends, Trend Seeker automatically enters a neutral state for at least one day before identifying a new opportunity.
Understanding the Trend Cycle
In the clip, John walks through Apple (AAPL) to show how Trend Seeker’s cycle plays out over time.
“When the market is in an uptrend, Trend Seeker creates green dots below the price,” John explained. “When it’s in a downtrend, you’ll see red dots above. But in between — when dots appear both above and below — that’s your hold period. The system is waiting to confirm a new trend.”
By reviewing the Trading Strategies panel on Barchart, John showed that over the last five years, Trend Seeker produced:
- 18 long (buy) signals on Apple
- Average holding period: ~50 days per trade
- Higher profitability on longer-duration trades
The takeaway? The longer you let the system ride a trend, the better your results. Even losing trades often move in your favor before reversing, which helps manage risk and refine exits.
Why Trend Seeker Works
Trend Seeker doesn’t rely on lagging indicators like moving averages alone. Instead, it’s a dynamic system that reacts to shifts in price structure and volatility.
That means you can:
- Spot trend reversals early
- Use color-coded confirmation for buy/sell decisions
- Identify neutral zones to avoid false signals
It’s like having a rule-based trading assistant built into your chart, constantly updating as new data comes in.
“Trend Seeker gives you probability bias,” John explained. “It helps you stay on the right side of the market by confirming what the dominant trend really is.”
How to Access Trend Seeker on Barchart
You can easily use Trend Seeker on any asset:
- Go to your Barchart Interactive Chart
- Under the Indicators, select Trend Seeker
Watch for:
🟢 Green = Bullish bias
🔴 Red = Bearish bias
⚪ Neutral = Hold period
To dive deeper into the system’s trade data, visit:
Trading Strategies Page → Here, you can see how many Trend Seeker trades have been triggered, their average holding periods, and cumulative profitability — all by symbol.
Pro Tip: Pair It With Technical Confirmation
For stronger setups, John recommends combining Trend Seeker signals with other technical tools like:
- Relative Strength Index (RSI) – confirms momentum
- Bollinger Bands – gauges volatility and trend strength
- Average True Range (ATR) – helps measure price targets or stop levels
Together, these filters can validate Trend Seeker’s bullish or bearish dots, and give traders more confidence before entering a trade.
Final Takeaway
Trading with the trend doesn’t have to be guesswork. Barchart’s Trend Seeker gives traders a simple visual roadmap for staying aligned with market direction, and for knowing when momentum is shifting.
Watch the Clip: Find Stocks to Trade Before the Rest of the Market
- Stream the Full Webinar: Unlock the Power of Trend Seeker
- Try Trend Seeker on Interactive Charts
- Explore Trend Seeker Alerts on New Recommendations
On the date of publication, Barchart Insights did not have (either directly or indirectly) positions in any of the securities mentioned in this article. All information and data in this article is solely for informational purposes. For more information please view the Barchart Disclosure Policy here.
More news from Barchart
- Two Straddles Define Wednesday’s Unusual Options Activity Across Key Stocks
- Find Stocks to Trade Before the Rest of the Market by Adding This Trend Indicator to Your Charts
- IBM Is Staring Down Quantum Advantage. Should You Buy IBM Stock First?
- Michael Burry Shutters Hedge Fund as Trump’s 50-Year Mortgage Threatens an $11 Trillion Housing Collapse – Is Big Short 2.0 Brewing in Housing, Not Tech?


