Nvidia (NVDA) found support at 170 on Tuesday and that appears to be a key level moving forward.
Today we’re looking at a broken wing butterfly trade that creates a profit zone between $165 and $175 with income potential of around $57. Yesterday, the stock closed around $177.82.
A broken wing butterfly with puts is a butterfly spread with long put strikes that are not at the same distance from the short put strike.
A broken wing butterfly has more risk on one side of the spread than on the other.
You can also think of it as a butterfly with a “skipped strike”.
The trade is usually set up as a slightly bullish trade.
A broken wing butterfly with puts is usually created buying a put, selling two lower puts and buying one further out-of-the-money put.
An ideal setup of the trade is to create the broken wing butterfly for a net credit, in this way, there is no risk on the upside.
The main risk with the trade is a sharp move lower early in the trade.
NVDA Broken Wing Butterfly Example
On NVDA, a December 19 expiry broken wing butterfly could be set up through buying the $370 put, selling two of the $410 puts and buying the $430 put.
Here are the details of the trade as of yesterday’s close:
Buy 1 December 19, $160 put @ 2.48
Sell 2 December 19, $170 put @ 4.95
Buy 1 December 19, $175 put @ 6.85
Notice that the upper strike put is 5 points away from the middle put and the lower put is 10 points away.
This broken wing butterfly trade will result in a net credit of $57, which means that if NVDA stays above $175, the profit will be $57 or 12.9%.
On the downside, the maximum loss can be calculated by taking the difference between the two widths (5) multiplied by 100, minus the premium received.
That gives us 5 x 100 - 57 = $443.
The maximum gain can be calculated as 5 x 100 + 57 = $557
The ideal scenario for the trade is that NVDA stays above $175 for the next month. The main expiration profit zone is between $165 and $175.
The trade starts with delta of 5, so has a slight bullish bias to start, but that will flip to slightly negative delta closer to expiry if NVDA is still above $175.
In terms of risk management, I would set a stop loss of 20% of the capital at risk, or if NVDA broke below $165.
This is what the trade looks like as of today:
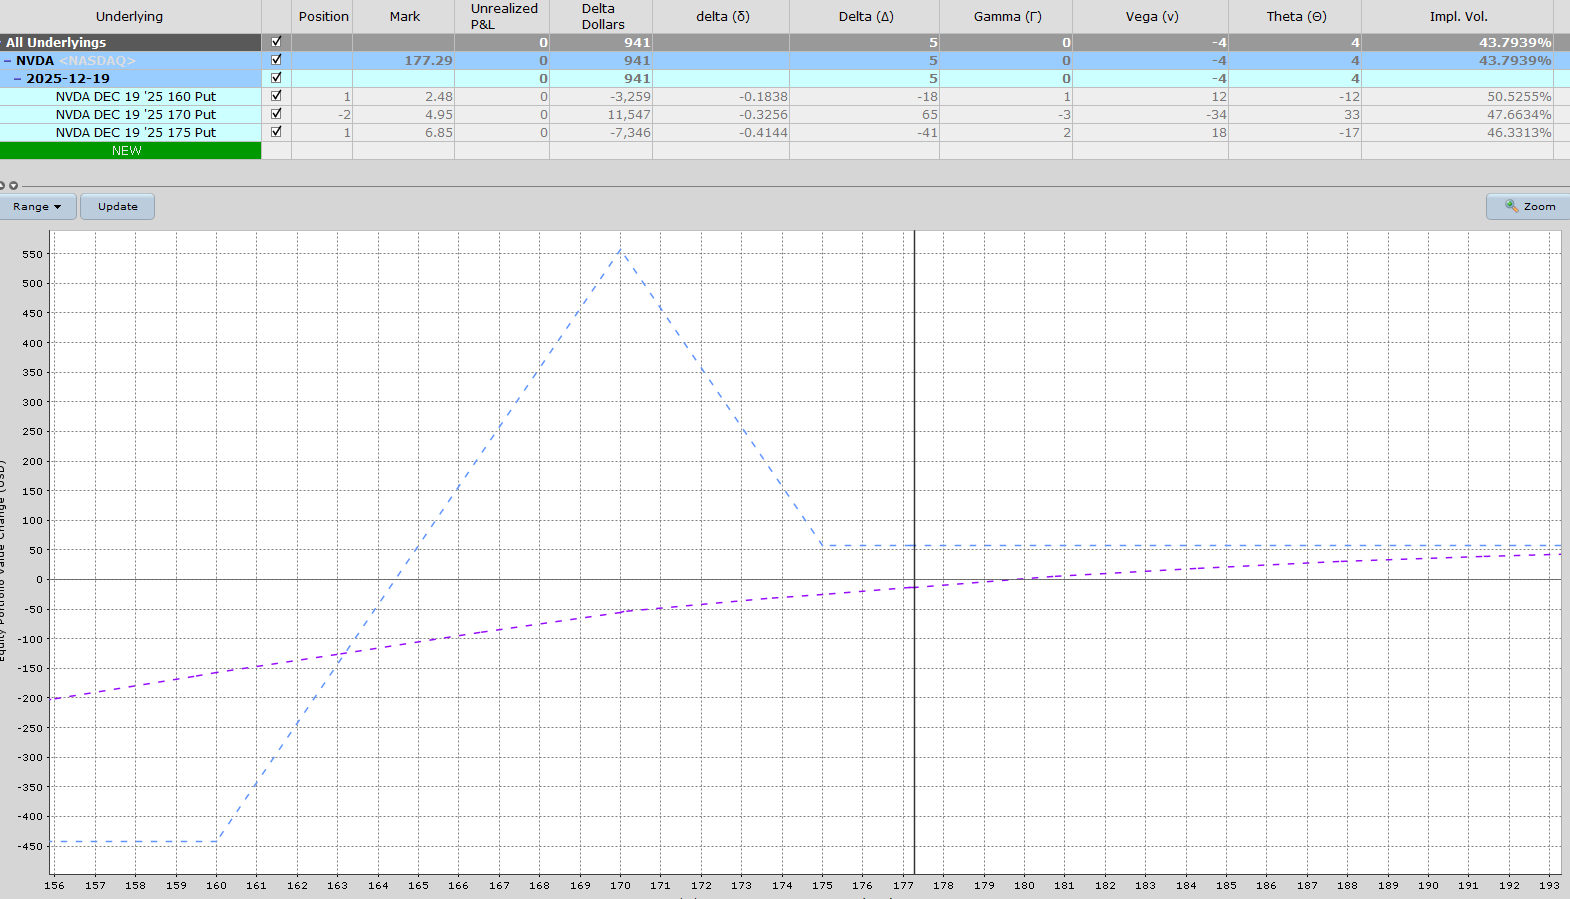
You can see the main risk in the trade is a drop in price early on. The blue line is the profit and loss at expiration and the purple line is the T+0 line. T+0 just means “today”.
So, we don’t want the stock to get into the profit tent too early.
What about in two weeks’ time? How does the trade look then?
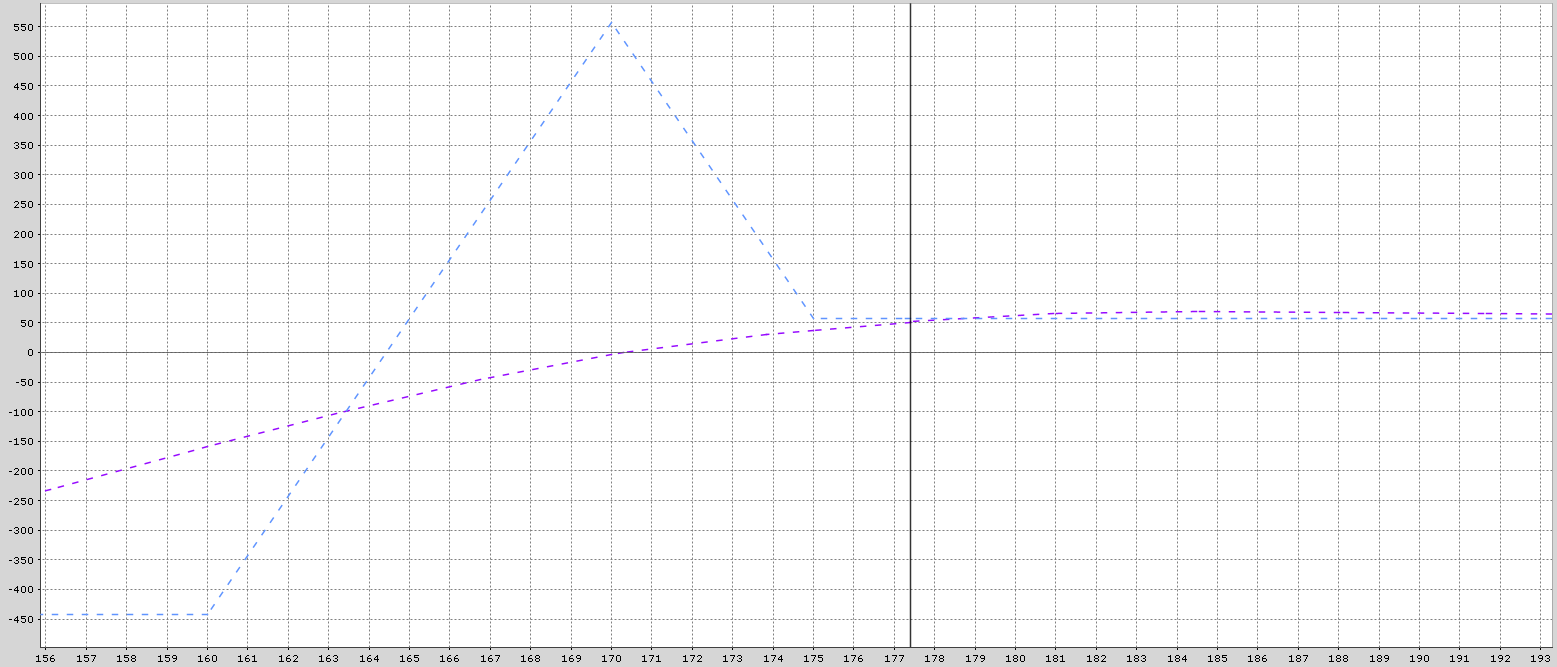
Looking a pretty good at any price above $170.
Summary
This strategy should move fairly slowly unless there is a sharp drop in the stock price.
You can do this on other stocks as well but remember to start small until you understand a bit more about how this all works.
Mitigating Risk
With any option trade, it’s important to have a plan in place on how you will manage the trade if it moves against you.
A stop loss of 20% might make sense in this scenario. If NVDA is below $170 near expiry, there will be assignment risk
Please remember that options are risky, and investors can lose 100% of their investment.
This article is for education purposes only and not a trade recommendation. Remember to always do your own due diligence and consult your financial advisor before making any investment decisions.
On the date of publication, Gavin McMaster had a position in: NVDA . All information and data in this article is solely for informational purposes. For more information please view the Barchart Disclosure Policy here.
More news from Barchart
- NVDA Broken Wing Butterfly Trade Targets A Profit Zone Between 165 and 175
- Lennar’s (LEN) Reality Looks Ugly—But Quant Traders Are Targeting THIS Options Spread
- Occidental Petroleum Could Hike Its Dividend - Price Target is At Least 21% Higher
- How to Ride Meta's 80% Rally With One Smart Options Trade


