This shortened week started off with the tech sector doing what it has done best this month, and even back in late 2025 — leading to the downside. Wednesday’s rebound is par for the course in modern markets, where every small dip gets a second chance. But the tech sector, specifically through the eyes of the biggest and longest-running exchange-traded fund (ETF) dedicated to that sector, is teetering.
SPDR S&P 500 Technology ETF (XLK) has a lot going for it — more than $90 billion in assets, a 27-year history, and a strong position in some of the most popular and iconic U.S. tech stocks. And at 31x earnings, this growth sector is not outrageously valued, at least when considering the prospects of the artificial intelligence (AI) boom.
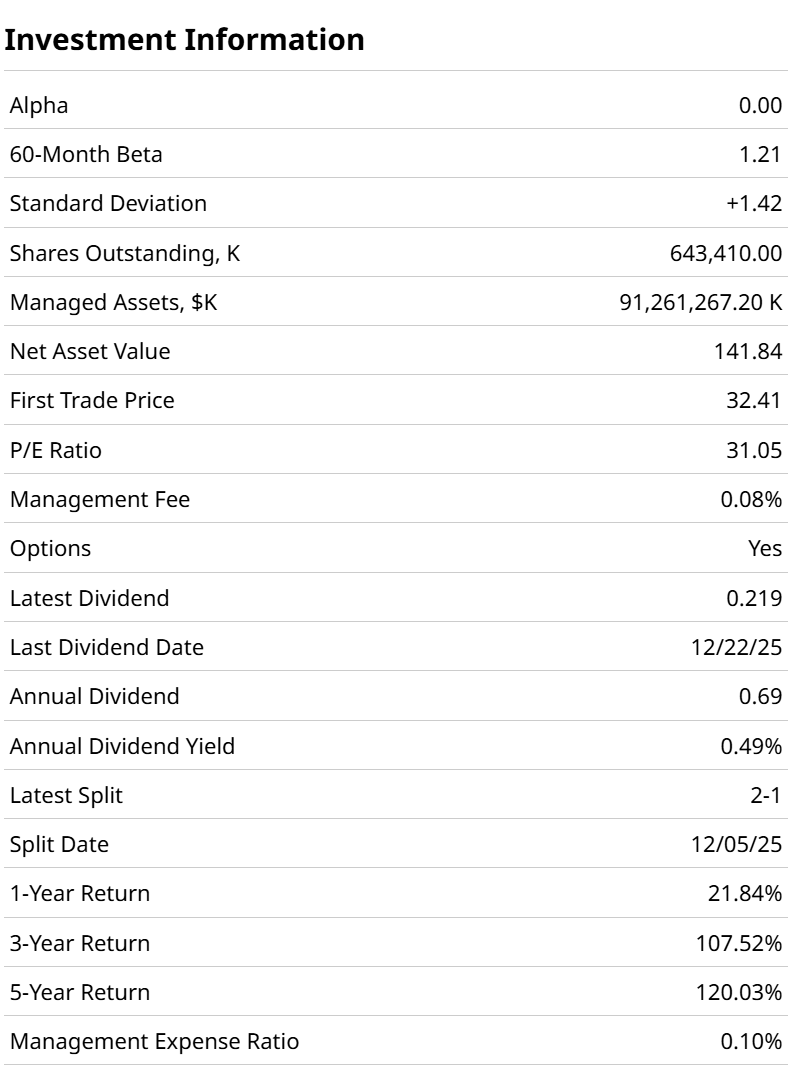
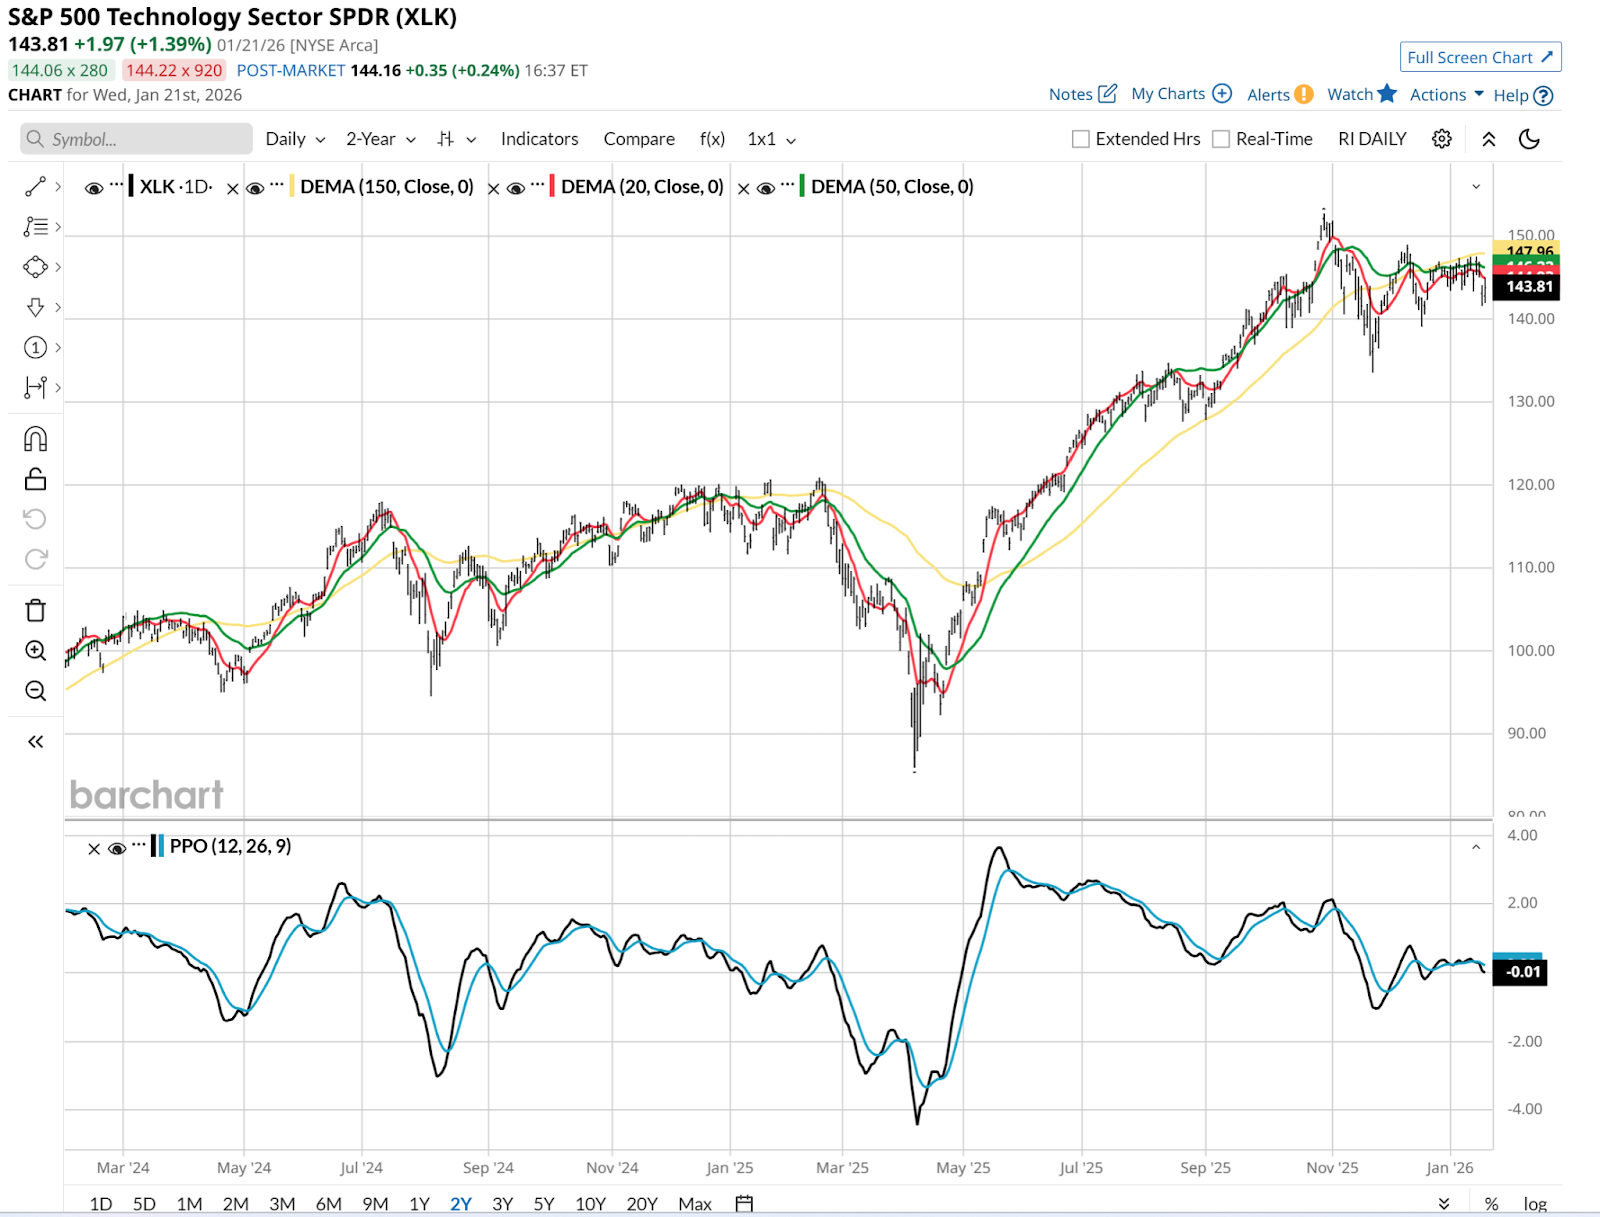
However, this chart is a problem. It’s been flat for a while now. And when a spike like the one we saw from April through October simply stops, we have to consider the possibility that the tech trade may be toast for a while.
XLK’s Dynamic Trio
What happens from here clearly sits on the shoulders of XLK’s biggest three stock holdings. Shown below, they account for more than 38% of the fund’s assets. Furthermore, only 10 stocks make up more than 60% of XLK’s portfolio. That means the others are hard-pressed to rescue the big holdings.
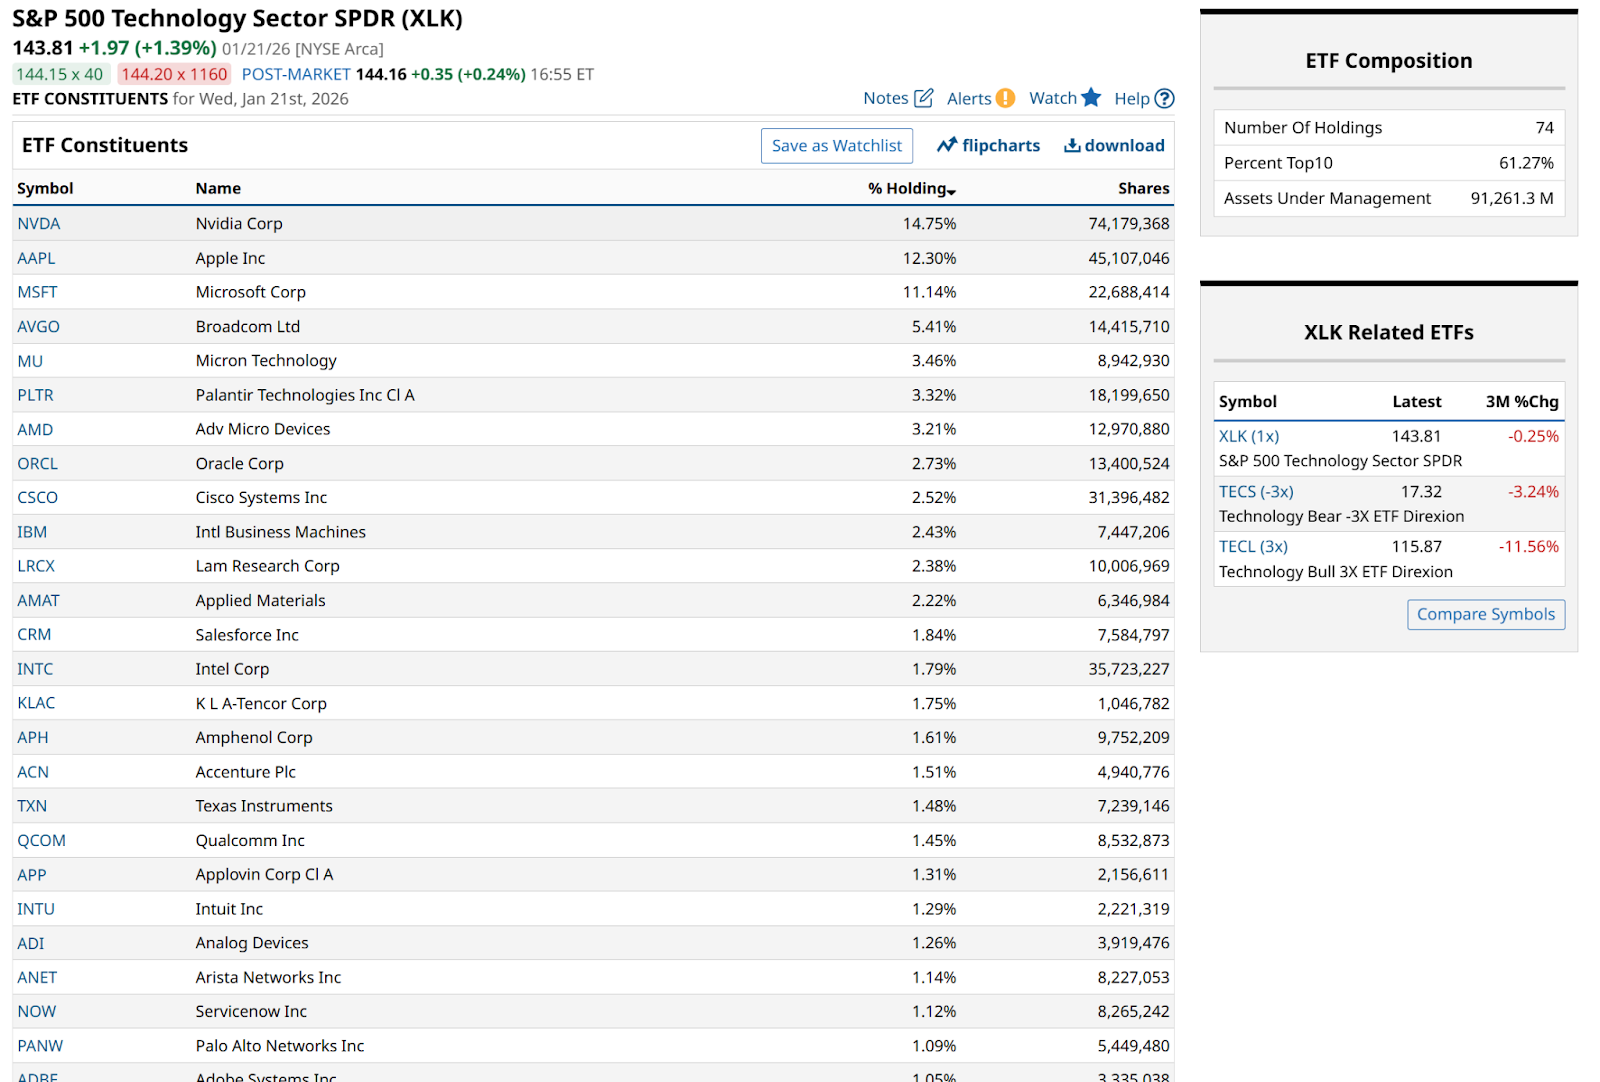
XLK’s Holdings: Who Is Still Standing?
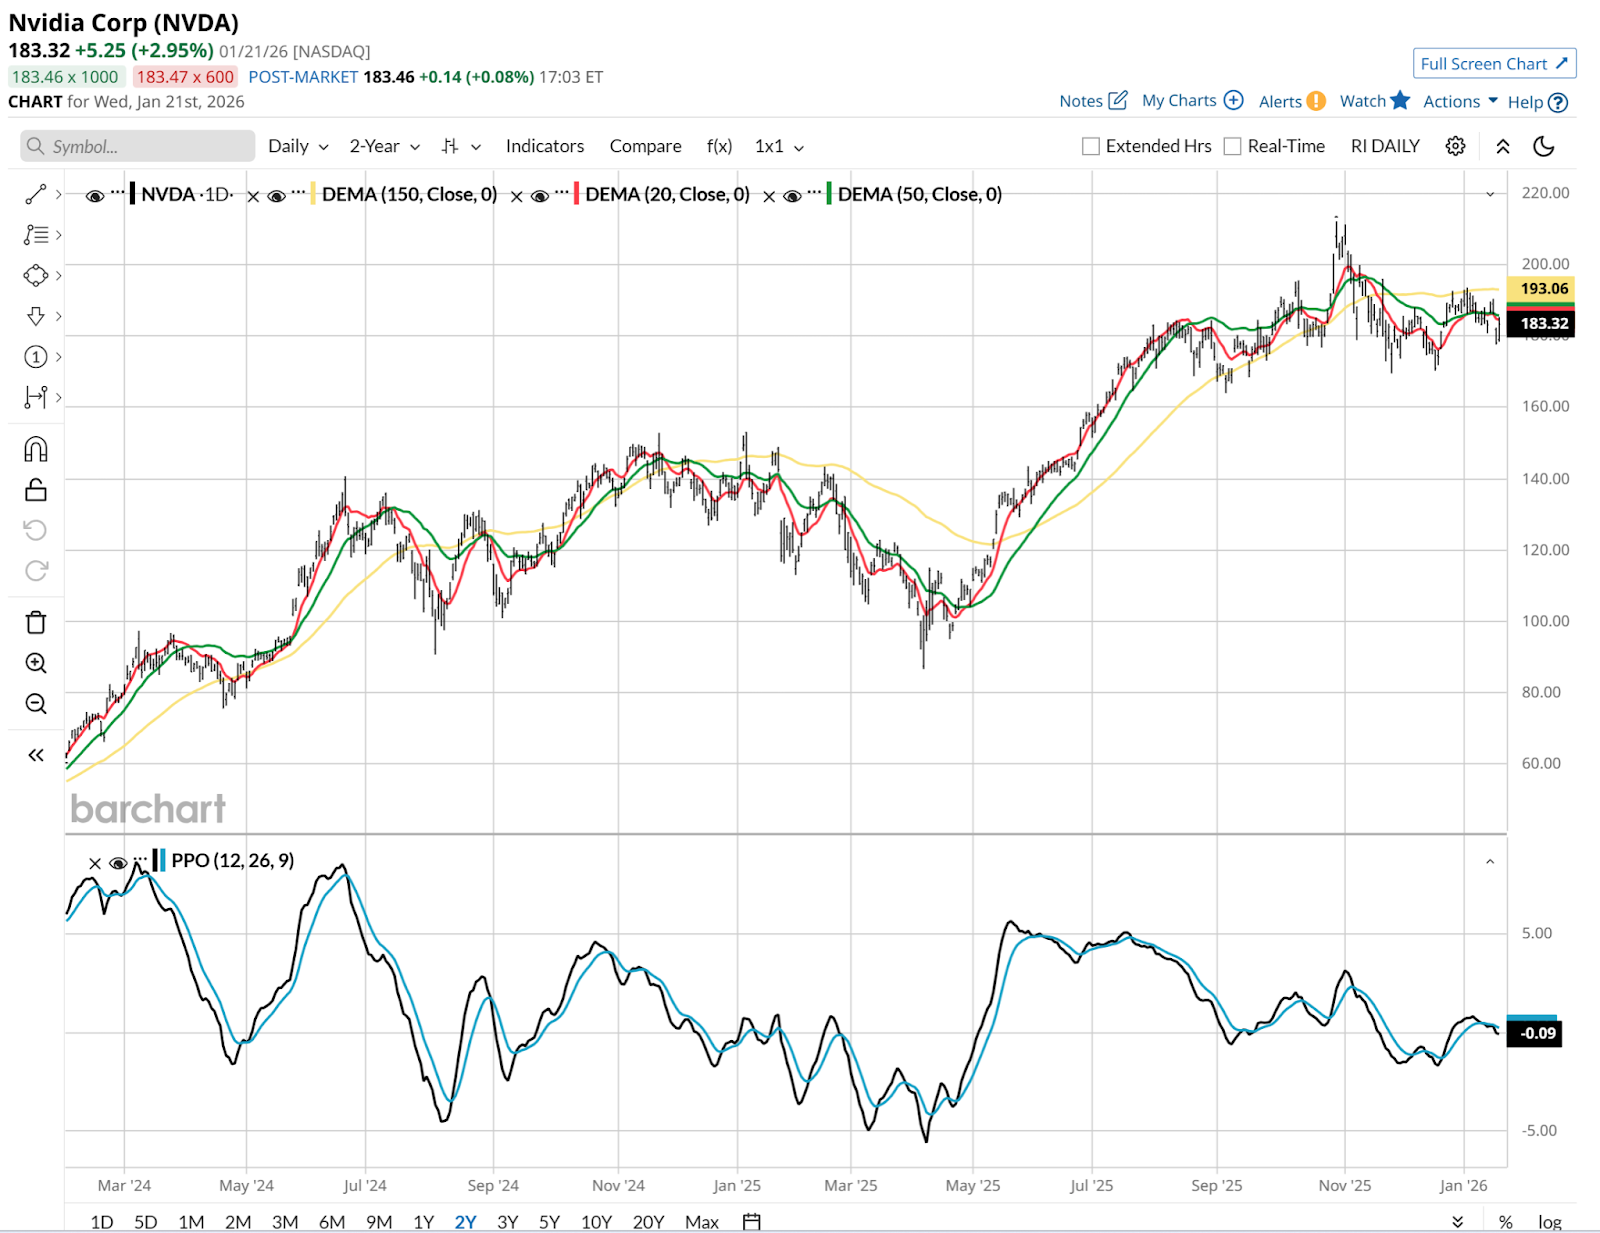
Of the top 25 holdings, most have succumbed to the January rotation out of expensive tech. However, three specific pockets are currently showing green on the screens. Whether it is the valuation reset in areas like software, as those companies start to look more like utilities, or simple buyer exhaustion in the case of stocks like top holding Nvidia (NVDA), this is not 2025 all over again. Price gains are hard to come by for traders here. And when they do, as we saw on Wednesday, it's just another step in a tight trading range.
The Strategy
My Avoid Big Loss (ABL) rule is currently very active for the tech sector. I can’t say the chart is a total turnoff. But when dead money is one of the better-case scenarios, I’d rather focus my attention elsewhere. The issue these days? There’s not much elsewhere, either.
Still, this is a liquid ETF with a liquid options market. So, that at least offers some risk-return tradeoff potential for we risk-managed types.
Here’s one for XLK, going out to June, which is typical of my go-to setup. I’m skipping the usual collar since the covered call writing side pays zilch unless I cut my upside potential way down. Instead, here’s a married put example:
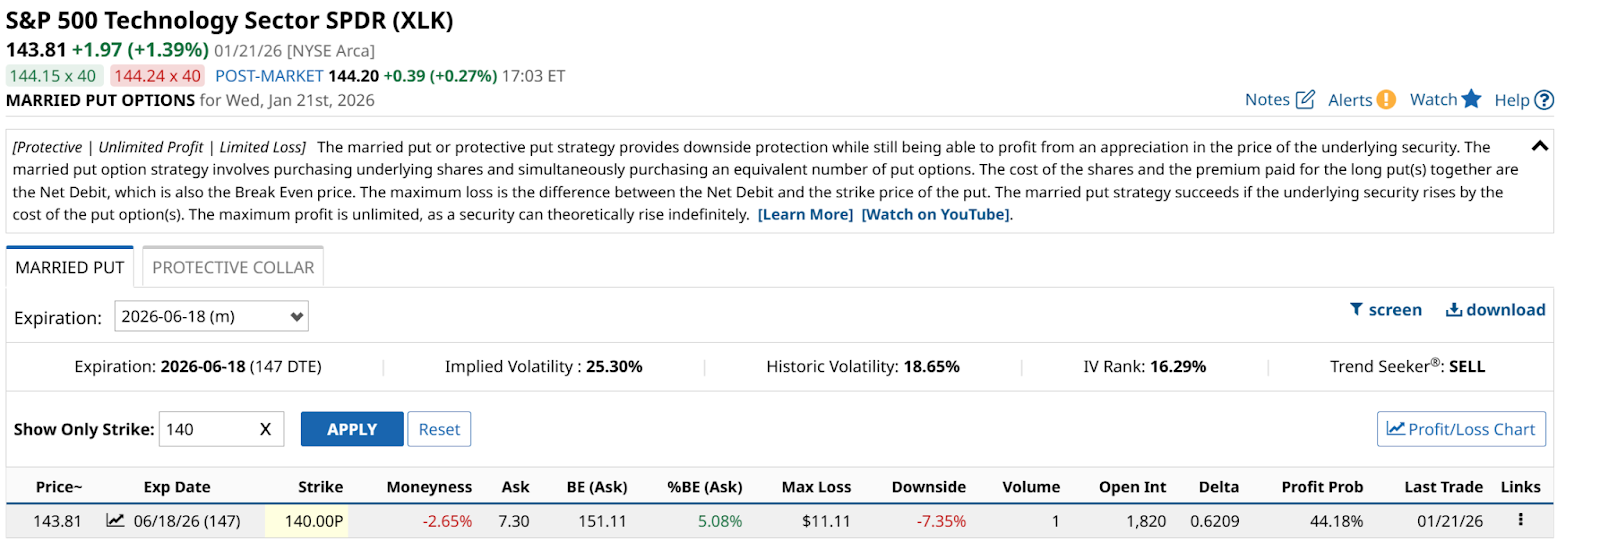
The puts are struck just below the current price, at $140 for this five-month time frame. I need the ETF to rise by 5% to break even, which is not bad considering how XLK is capable of performing if the market again shrugs off its present concerns.
As opposed to a collar, my upside is unlimited. At least until June expiration. With a volatile sector, now under the radar for the reasons discussed above, if I’m entering XLK, it’s with a safety net — a married put, or simply a smaller-than-normal position size.
Rob Isbitts is a semi-retired fiduciary investment advisor and fund manager. Find his investment research at ETFYourself.com. To copy-trade Rob’s portfolios, check out the new PiTrade app. His new blog on racehorse ownership as an alternative asset is at HorseClaiming.com.
On the date of publication, Rob Isbitts did not have (either directly or indirectly) positions in any of the securities mentioned in this article. All information and data in this article is solely for informational purposes. For more information please view the Barchart Disclosure Policy here.
More news from Barchart
- There's Trouble in 2026 for Tech Stock ETFs. How To Play XLK Right Now.
- How to Invest in the New Era of Agentic AI for Biotech Stocks
- How to Find High-Alpha Stocks That Can Change the Game for Momentum Traders and Investors
- Morningstar’s New Generative AI Index Could Unlock Opportunities in OpenAI and Anthropic for Everyday ETF Investors


