Insurance brokerage firm Brown & Brown (NYSE: BRO) missed Wall Street’s revenue expectations in Q3 2026, but revenue rose 7.4% year on year to $1.73 billion. Its non-GAAP profit of $1.07 per share was 1.4% below analysts’ consensus estimates.
For more on Brown & Brown, read the full research report for free.
Brown & Brown (BRO) Q3 2026 highlights:
- Revenue $1.73 billion vs S&P analysts’ consensus estimates of $1.76 billion (7.4% year-on-year growth, 2.1% miss)
- Adjusted EPS $1.07 vs S&P analysts’ consensus estimates of $1.08 (1.4% miss)
- Adjusted EBITDA $597 million vs analysts’ consensus estimates of $603.1 million (34.6% margin, 1% miss)
- Organic revenue rose 1.2% year on year (miss)
- Market capitalization $24.42 billion
J. Powell Brown, president and chief executive officer of the Company, noted, “The third quarter reflected the incredible efforts of our teammates to win more customers in spite of a challenging rate environment. Our capabilities were broadly enhanced by the addition of approximately 5,000 new teammates from Accession, just over a year ago.”
Revenue growth
A company’s long-term revenue performance is one signal of its overall quality. Any business can have short-term success, but a top-tier one grows for years.
With $6.91 billion in revenue over the past 12 months, Brown & Brown is one of the larger companies in the business services industry and benefits from a well-known brand that influences purchasing decisions.
Brown & Brown’s revenue grew at an 18.5% compounded annual growth rate over the last five years, indicating stronger demand than at many business services companies.
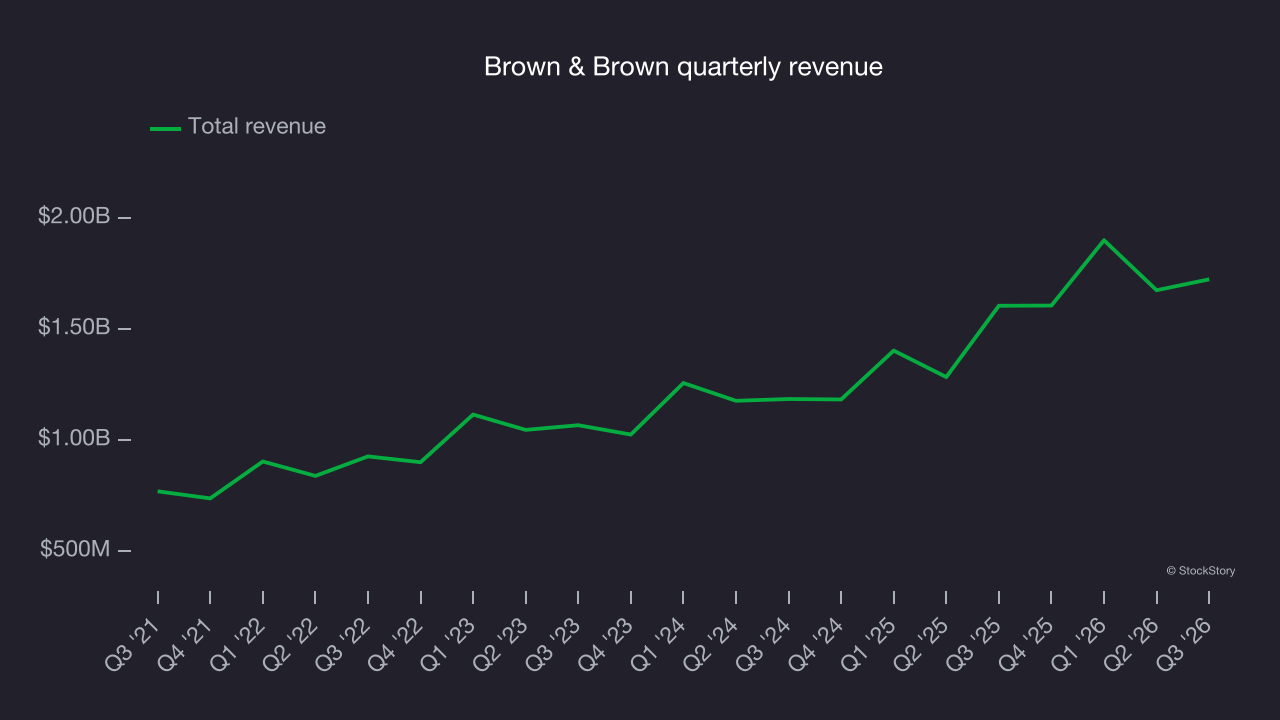
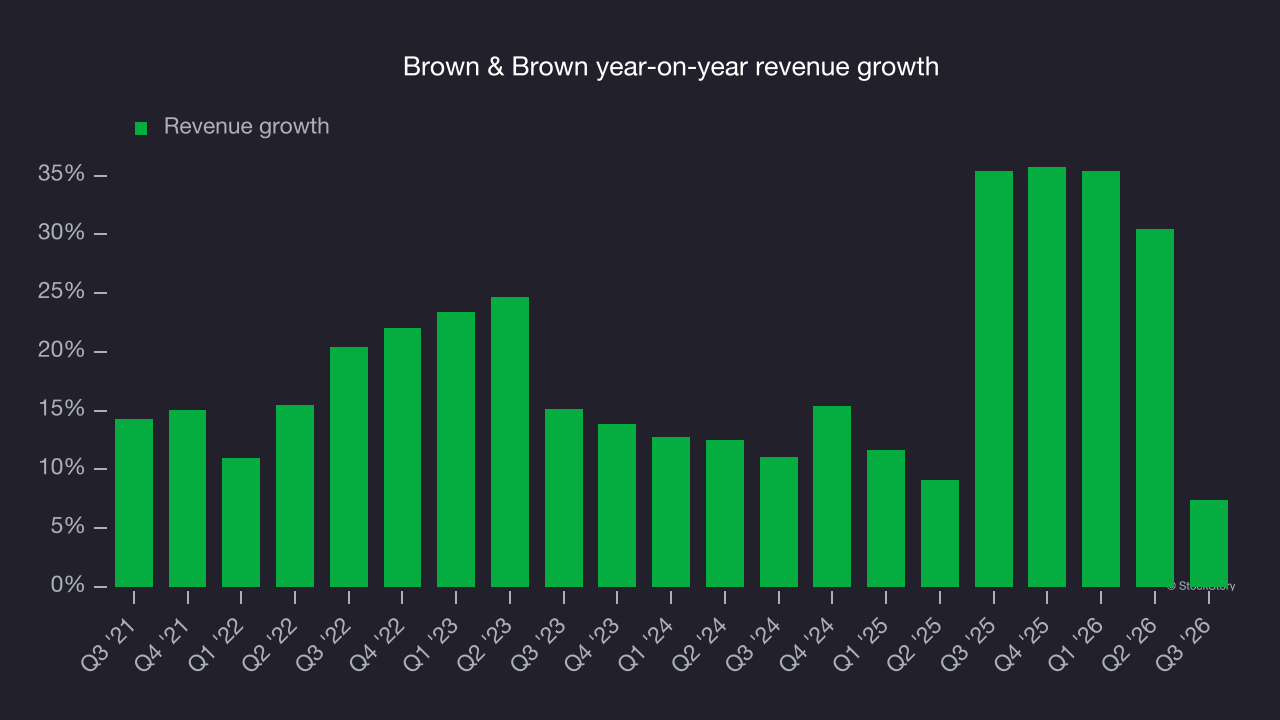
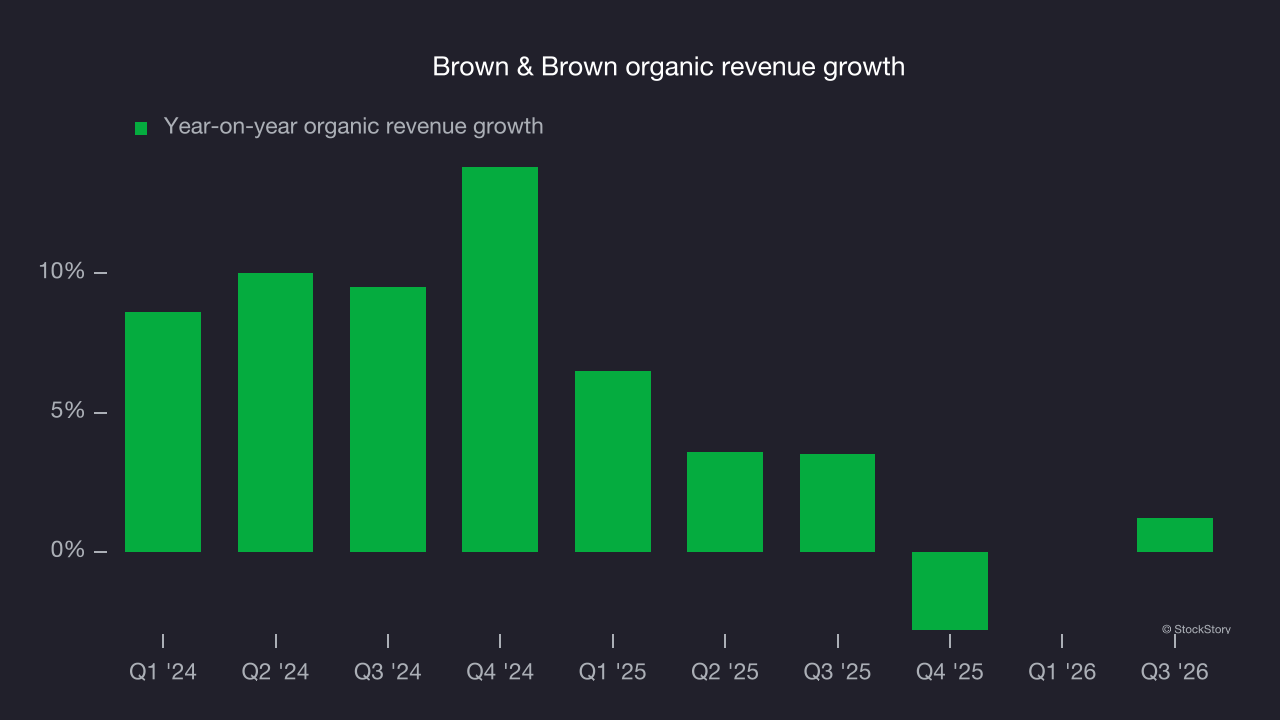
This quarter, Brown & Brown’s revenue grew by 7.4% year on year to $1.73 billion, missing Wall Street’s consensus estimates.
Looking ahead, sell-side analysts expect revenue to grow 4.2% over the next 12 months, according to S&P, a deceleration versus the last two years. That underwhelming outlook suggests its products and services will see some demand headwinds. On the positive side, the company is tracking well in other measures of financial health.
Earnings per share
We track the long-term change in earnings per share (EPS) for the same reason as long-term revenue growth. Compared to revenue, however, EPS highlights whether a company’s growth is profitable.
Brown & Brown’s EPS grew at a 16.4% compounded annual growth rate over the last five years. However, this performance trailed its 18.5% annualized revenue growth, indicating the company became less profitable on a per-share basis as it expanded.
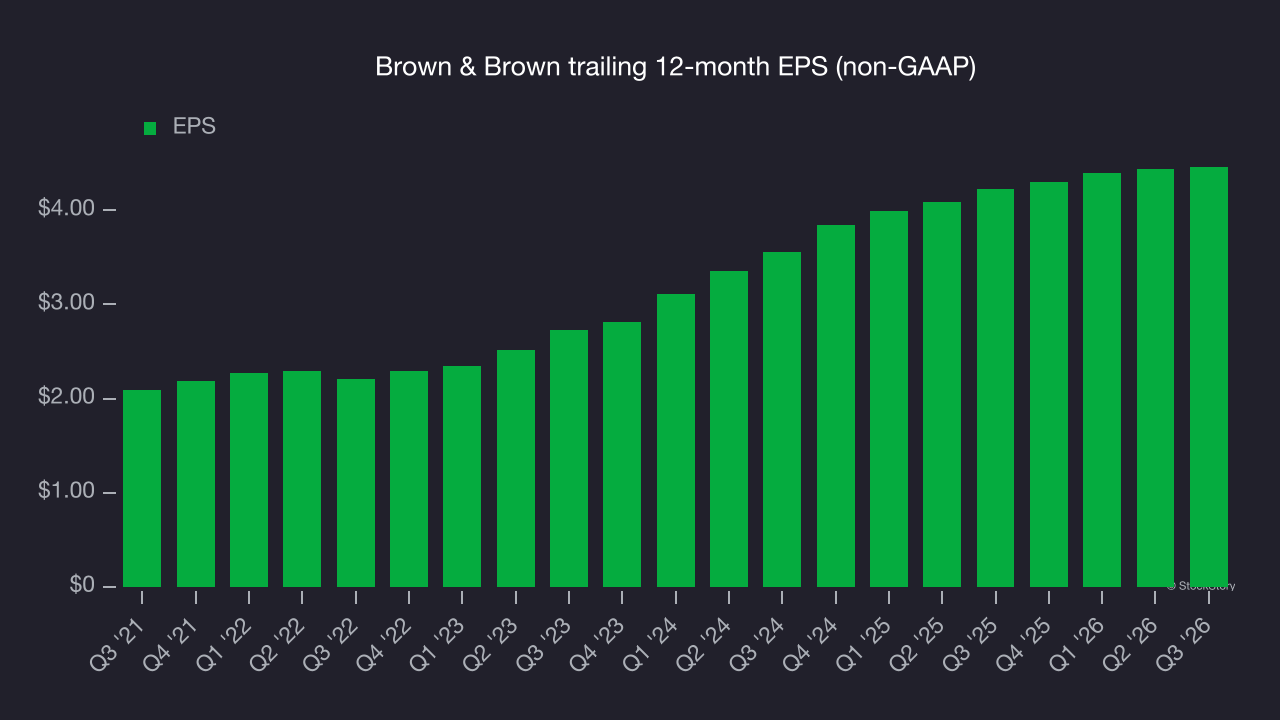
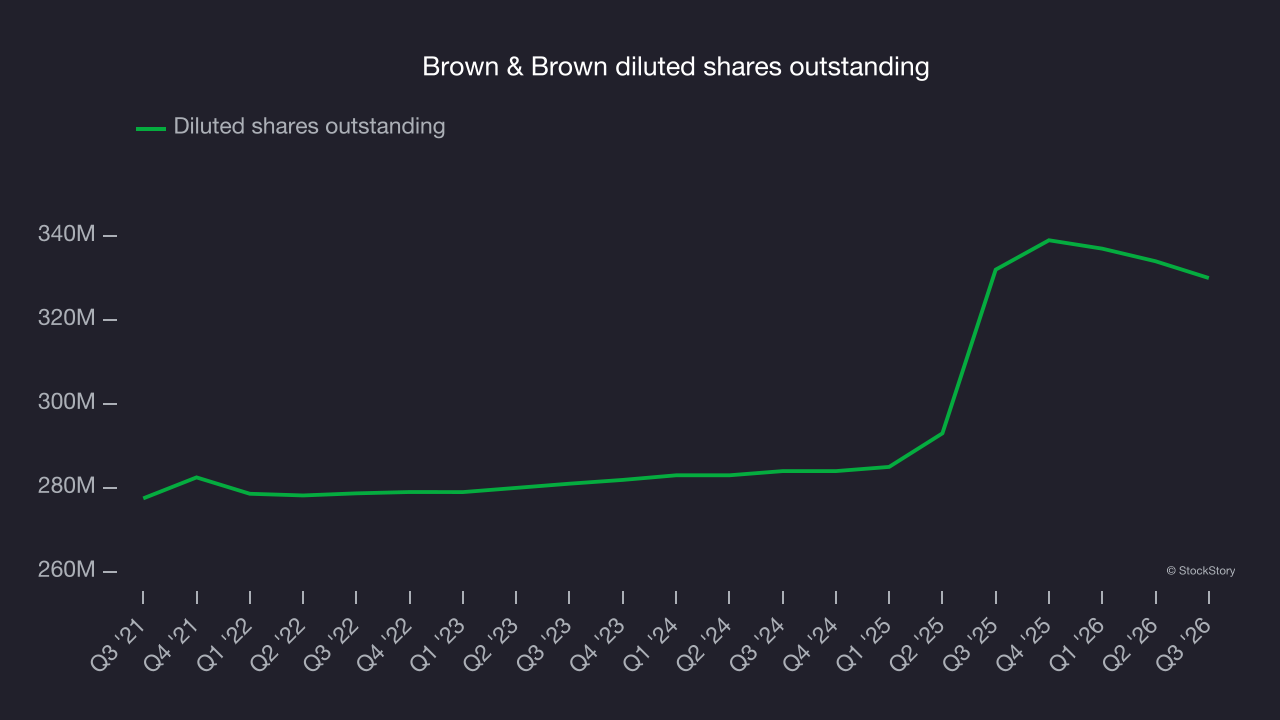
Like with revenue, we analyze EPS over a more recent period because it can provide insight into an emerging theme or development for the business.
For Brown & Brown, its two-year annual EPS growth of 11.9% was lower than its five-year trend. This was underwhelming, but the company performed well on other measures of financial health.
In Q3, Brown & Brown reported adjusted EPS of $1.07, up from $1.05 in the same quarter last year. Despite growing year on year, this result slightly missed analysts’ consensus estimates, but long-term adjusted EPS growth matters more than short-term movements. Over the next 12 months, Wall Street expects Brown & Brown’s full-year EPS to grow 6.3% from $4.46 to $4.74, according to S&P.
Key takeaways from Brown & Brown’s Q3 results
Brown & Brown’s quarter offered few positives: both revenue and organic revenue fell short of Wall Street’s consensus estimates. It was a disappointing quarter, and shares edged lower 1.8% to $69.93 immediately after the results.
Brown & Brown may have had a difficult quarter, but does that create an investment opportunity? What happened in the latest quarter matters, but not as much as longer-term business quality and valuation when deciding whether to invest in this stock. For more on Brown & Brown, read the full research report here (it’s free).