Electronic component manufacturer Belden (NYSE: BDC) reported Q3 2026 results beating Wall Street’s revenue expectations, with revenue up 38.3% year on year to $966 million. Guidance for next quarter’s revenue was better than expected at $970 million at the midpoint, 0.6% above analysts’ consensus estimates. Its non-GAAP profit of $2.26 per share was in line with analysts’ consensus estimates.
For more on Belden, read our free full research report.
Belden (BDC) Q3 2026 highlights:
- Revenue $966 million vs S&P analysts’ consensus estimates of $961.1 million (38.3% year-on-year growth, 0.5% beat)
- Adjusted EPS $2.26 vs S&P analysts’ consensus estimates of $2.26 (in line)
- Adjusted EBITDA $171 million vs analysts’ consensus estimates of $171 million (17.7% margin, in line)
- Revenue guidance $970 million at the midpoint for Q4 2026, roughly in line with what analysts were expecting
- Adjusted EPS guidance $2.28 at the midpoint for Q4 2026, roughly in line with what analysts were expecting
- Operating margin 1.7%, down from 10.9% in the same quarter last year
- Free cash flow margin 8.5%, similar to the same quarter last year
- Market capitalization $4.17 billion
"Belden delivered another record quarter, with revenue of $966 million, up 38% year over year and 11% organically, and Adjusted EPS of $2.26, up 15% year over year. We also surpassed $1 billion in quarterly orders for the first time, with orders up 46% year over year and 16% organically, and a book-to-bill of 1.05x," said Ashish Chand, President and CEO of Belden Inc. "Demand remains robust across our key markets as AI and automation drive continued investment in networking infrastructure, from the data center to the factory floor. Our data center business reached an important milestone, with a signed agreement to supply $100 million of fiber assemblies in 2027. With this announcement, we now expect our data center business to grow by more than 50% next year. Our Ruckus integration is progressing, and we are encouraged by the growing cross-selling funnel and positive conversations we are having with customers. Belden is increasingly positioned as a networking partner for physical AI and automation, and the momentum we are seeing gives us confidence in the opportunity ahead."
Revenue growth
Reviewing a company’s long-term revenue performance reveals insights into its quality. Any business can deliver a good quarter or two, but many enduring ones grow for years. Belden’s revenue grew at a mediocre 7.4% annualized rate over the last five years, falling short of the rest of the industrials sector, but there are still things to like about Belden.
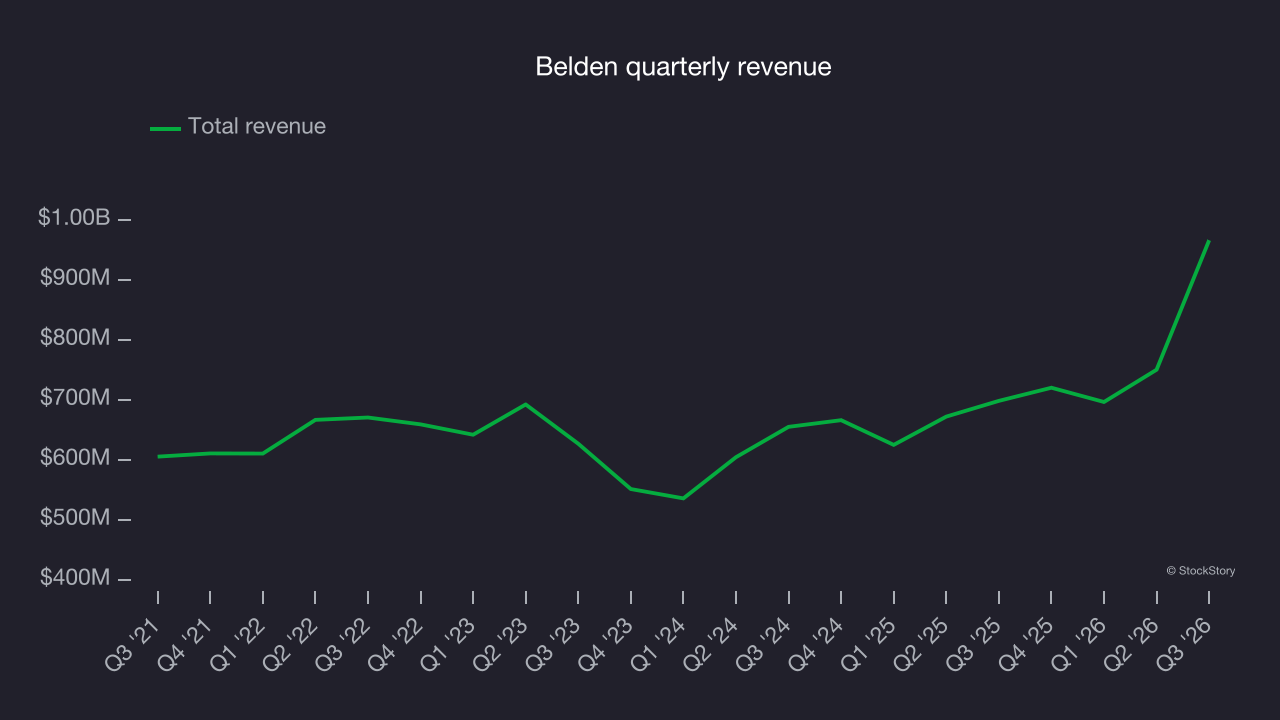
Long-term growth is the most important, but within industrials, a half-decade historical view may miss new industry trends or demand cycles. Belden’s annualized revenue growth of 15.6% over the last two years is above its five-year trend, suggesting its demand recently accelerated. 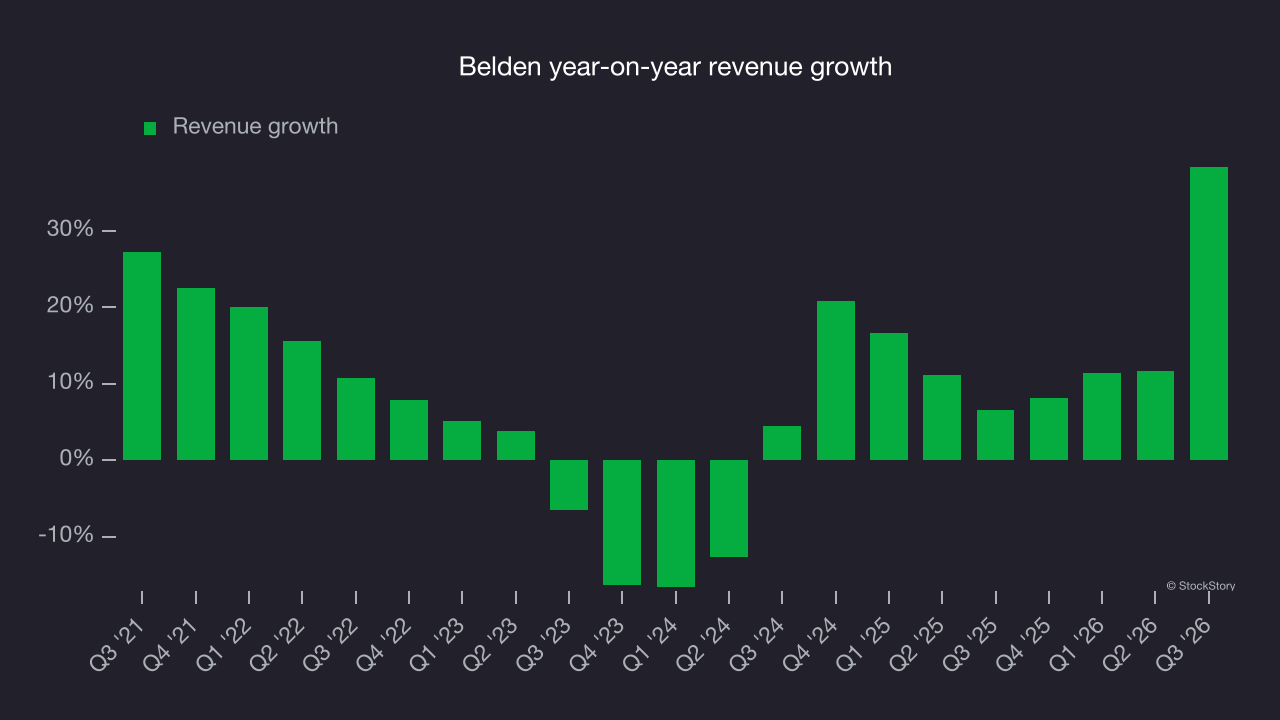
This quarter, Belden reported year-on-year revenue growth of 38.3%, and its $966 million of revenue exceeded Wall Street’s consensus estimates by 0.5%. Company management is currently guiding for a 34.7% year-on-year increase in revenue next quarter.
Looking further ahead, sell-side analysts expect revenue to grow 24.6% over the next 12 months, according to S&P, an improvement versus the last two years. This strong growth projection suggests its newer products and services will fuel better revenue performance.
Operating margin
Operating margin is one of the best measures of profitability because it shows how much money a company earns after procuring and manufacturing its products, marketing and selling those products and, most importantly, keeping them relevant through research and development.
Belden has managed its cost base well over the last five years. It demonstrated solid profitability for an industrials business, producing an average operating margin of 11.5%. That outcome is unsurprising given its high gross margin baseline.
Analyzing the trend in its profitability, Belden’s operating margin decreased by 4.9 percentage points over the last five years. This raises questions about the company’s expense base because its revenue growth should have given it leverage on its fixed costs, resulting in better economies of scale and profitability.
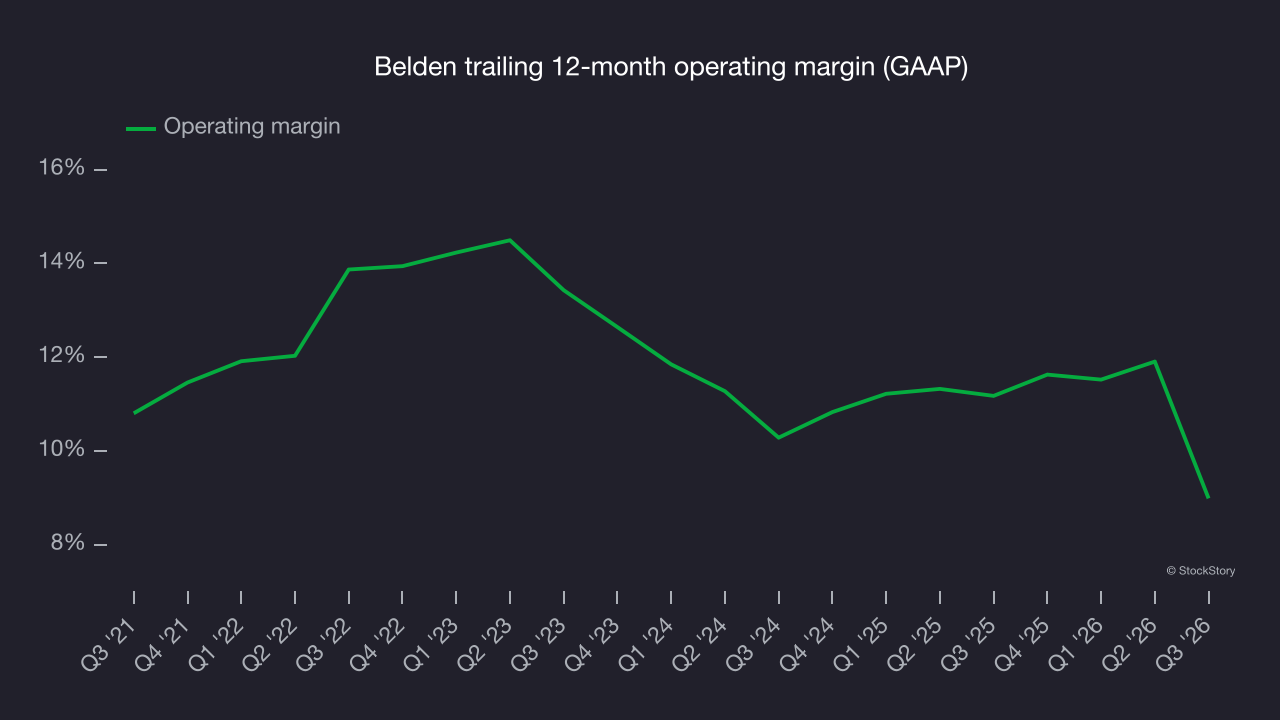
In Q3, Belden generated an operating margin of 1.7%, down 9.2 percentage points year on year. The larger decline in operating margin than in gross margin suggests Belden was less efficient as expenses such as marketing, R&D and administrative overhead increased.
Earnings per share
Revenue trends explain a company’s historical growth, but the long-term change in earnings per share (EPS) points to the profitability of that growth. For example, a company could inflate its revenue through excessive spending on advertising and promotions.
Belden’s EPS grew at a 14.1% compounded annual growth rate over the last five years, higher than its 7.4% annualized revenue growth. However, this alone doesn’t tell us much about its business quality because its operating margin didn’t improve.
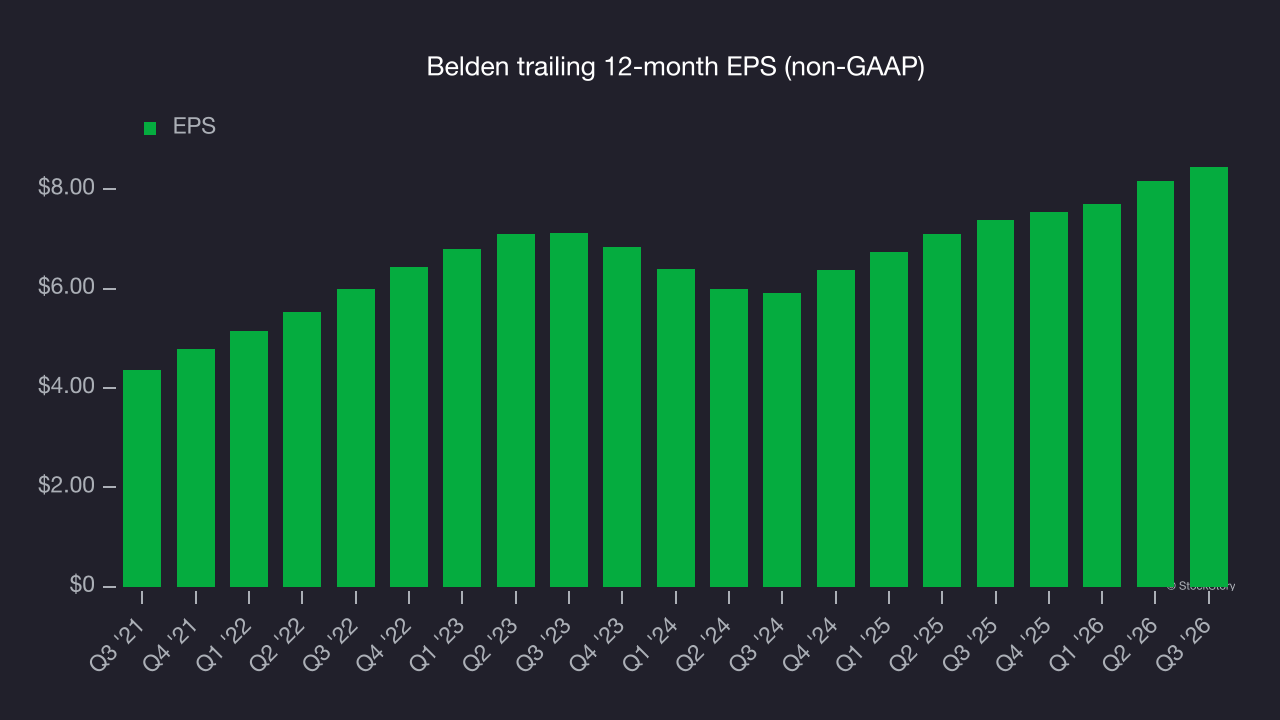
Diving into Belden’s quality of earnings can give us a better understanding of its performance. A five-year view shows that Belden has repurchased its stock, shrinking its share count by 14%. This tells us its EPS outperformed its revenue not because of increased operational efficiency but financial engineering, as buybacks boost per share earnings. 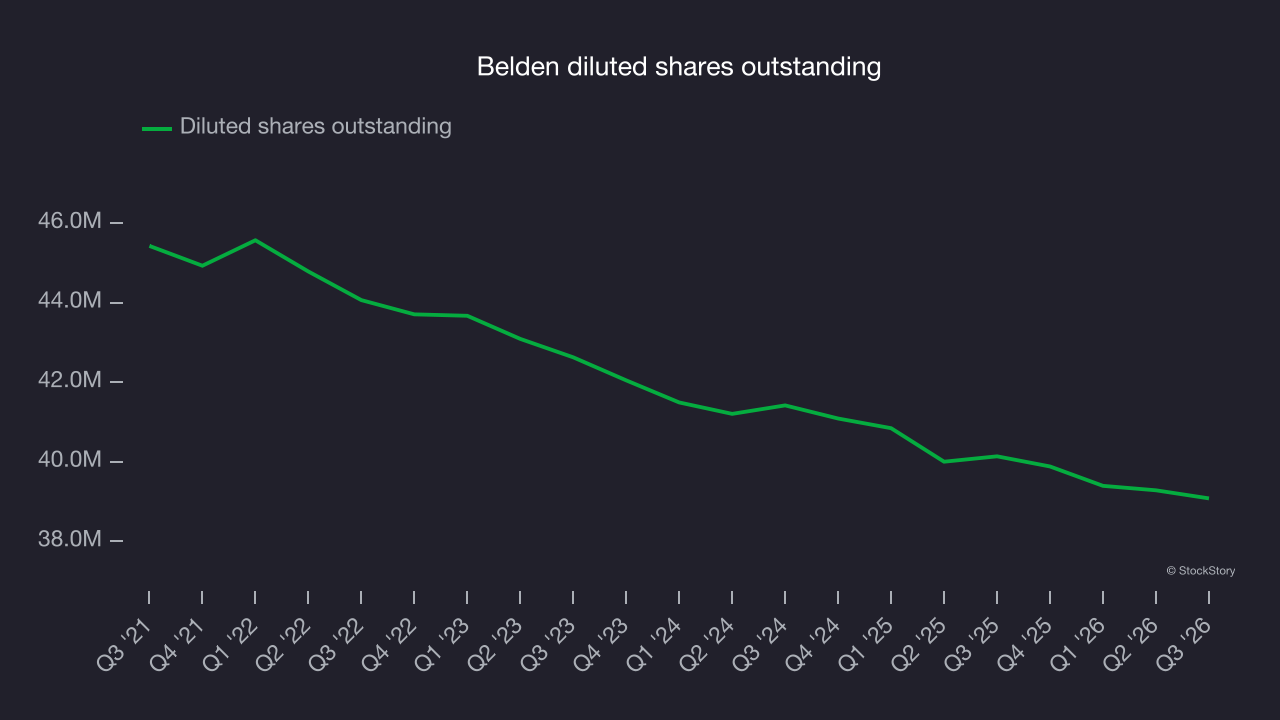
As with revenue, we analyze EPS over a shorter period to see if we are missing a change in the business.
For Belden, its two-year annual EPS growth of 19.6% was higher than its five-year trend. That acceleration is a positive sign, particularly given the already high base.
In Q3, Belden reported adjusted EPS of $2.26, up from $1.97 in the same quarter last year. This result was close to analysts’ consensus estimates. Over the next 12 months, Wall Street expects Belden’s full-year EPS to grow 14.5% from $8.45 to $9.67, according to S&P.
Key takeaways from Belden’s Q3 results
Belden’s narrow revenue beat against analysts’ consensus estimates made for a decent quarter, but investors were likely hoping for more. Shares fell 4.9% to $101.38 immediately after the release.
To assess Belden as an investment at its current price, consider its valuation, business quality and what happened in the latest quarter. For more on Belden, read our full research report here (it’s free).