Financial technology provider Broadridge (NYSE: BR) reported calendar Q3 2026 (fiscal Q1 2027) results exceeding the market’s revenue expectations, with revenue up 5% year on year to $1.67 billion. Its non-GAAP profit of $1.56 per share was 14% above analysts’ consensus estimates.
For more on Broadridge, read our full research report, available free.
Broadridge (BR) Q3 CY2026 highlights:
- Revenue $1.67 billion vs S&P analysts’ consensus estimates of $1.64 billion (5% year-on-year growth, 1.7% beat)
- Adjusted EPS $1.56 vs S&P analysts’ consensus estimates of $1.37 (14% beat)
- Operating margin 10.4%, down from 11.9% in the same quarter last year
- Free cash flow margin 4.7%, up from 0.8% in the same quarter last year
- Market capitalization $20.8 billion
"With a strong start to the year, we are reaffirming our fiscal year 2027 guidance, including 6-8% Recurring revenue growth constant currency, 8-12% Adjusted EPS growth, Free cash flow conversion of 100%+, and strong Closed sales of $290-$330 million," Mr. Gokey concluded.
Revenue growth
A company’s long-term revenue performance is one signal of its overall quality. Any business can deliver a good quarter or two, but the best consistently grow over the long term.
With $7.56 billion in revenue over the past 12 months, Broadridge is one of the larger companies in the business services industry and benefits from a well-known brand that influences purchasing decisions.
Broadridge grew its revenue at a solid 7.9% compounded annual growth rate over the last five years. This shows demand was stronger than at many business services companies.
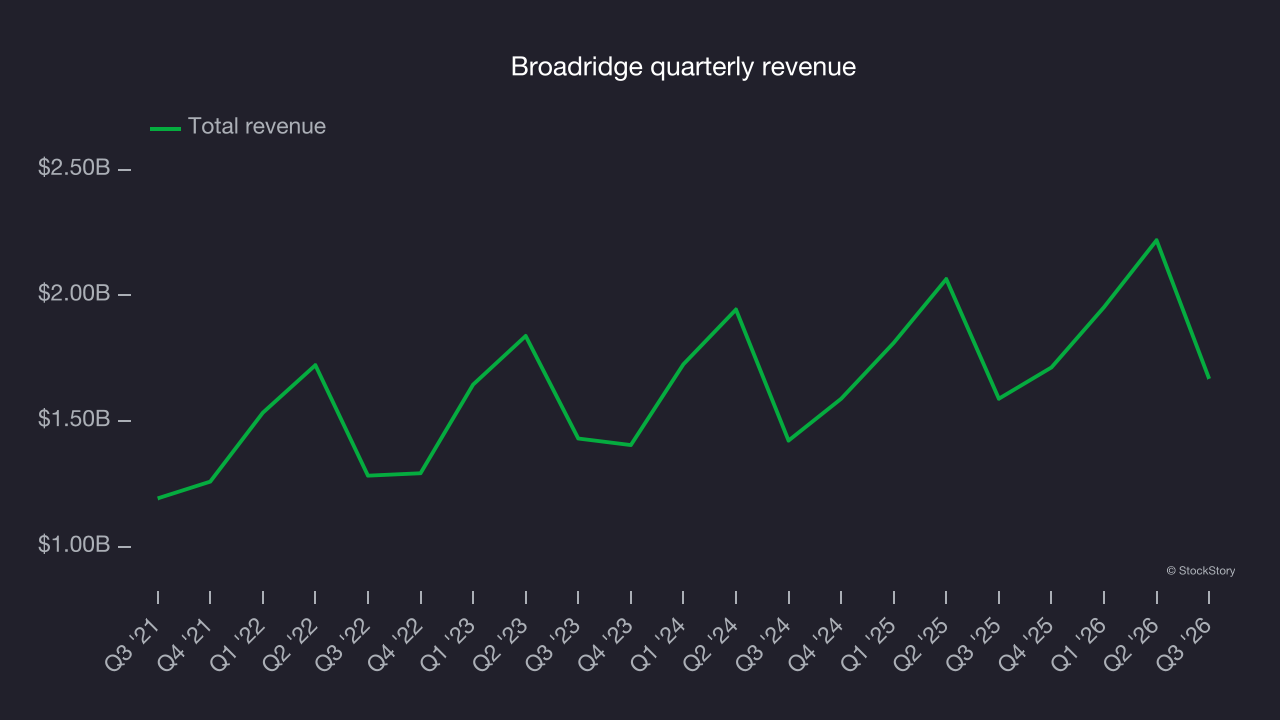
Long-term growth matters most, but within business services, a half-decade historical view may miss recent innovations or disruptive industry trends. Broadridge’s annualized revenue growth of 7.8% over the last two years aligns with its five-year trend, suggesting its demand was predictably strong. 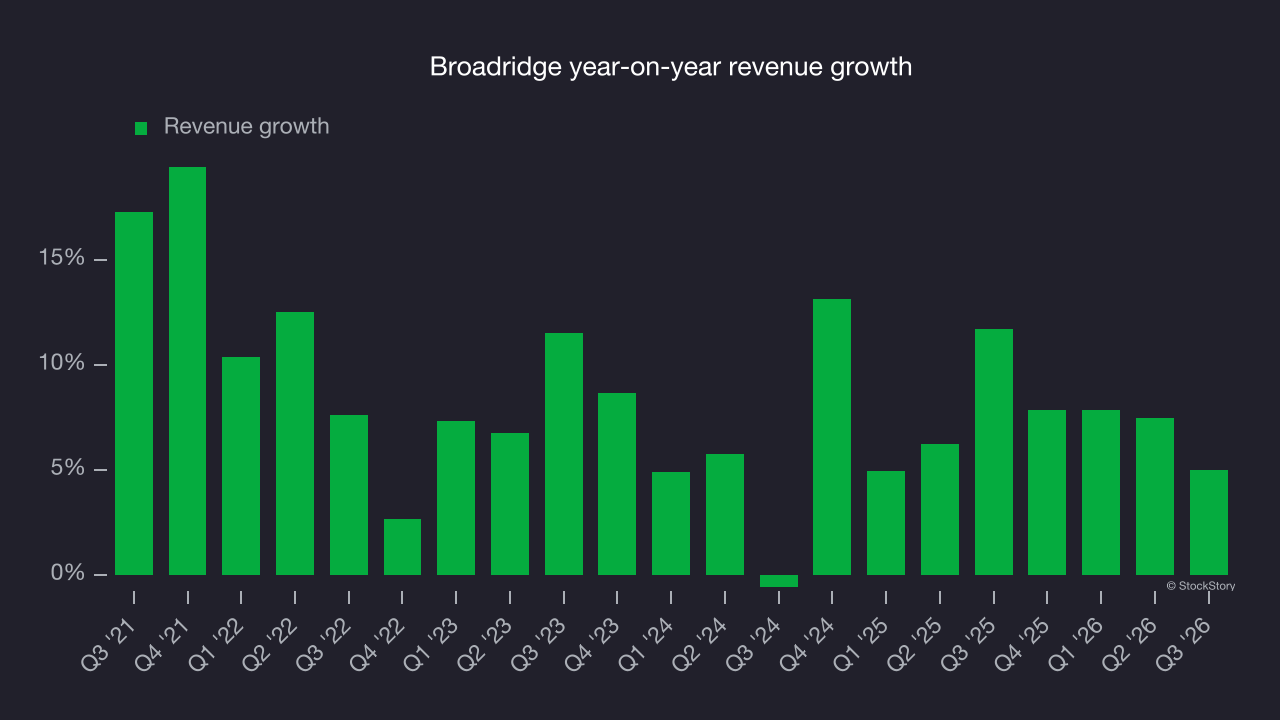
A closer look at its most important segment, Investor Communication Solutions, offers more detail on the company’s revenue dynamics. Over the last two years, Broadridge’s Investor Communication Solutions revenue (shareholder materials) averaged 6.6% year-on-year growth. 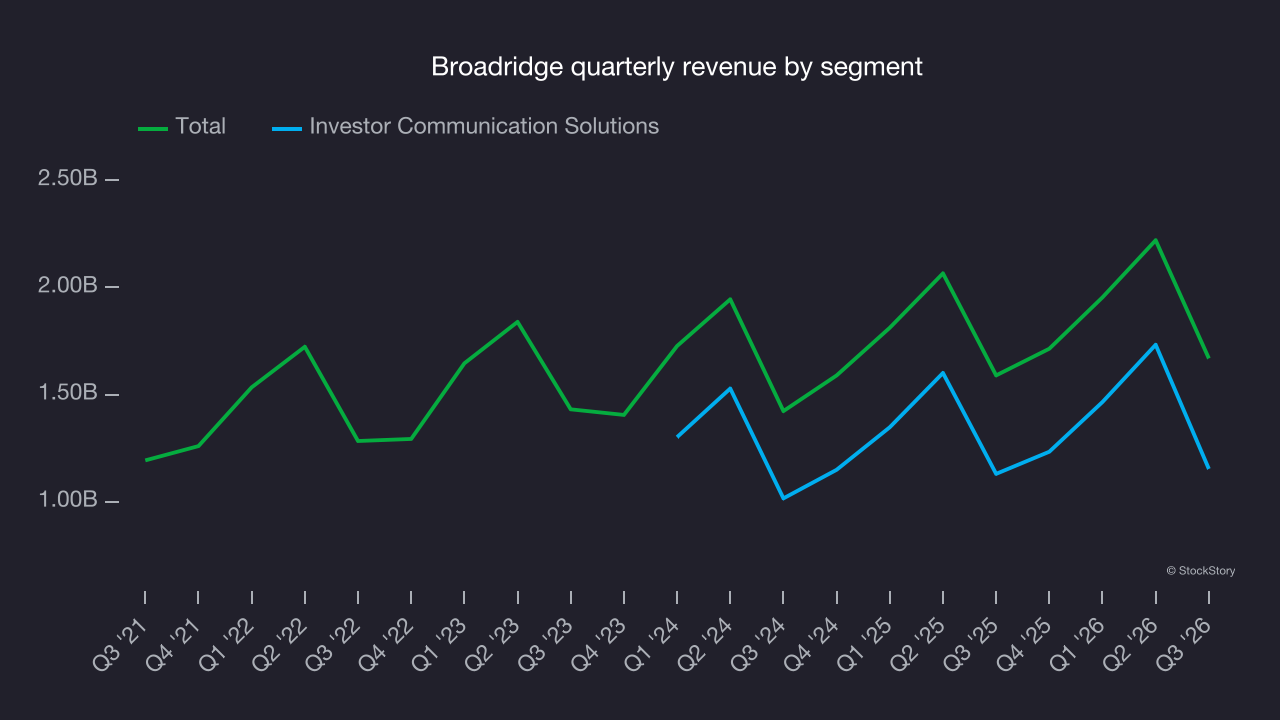
This quarter, Broadridge reported modest year-on-year revenue growth of 5% but beat Wall Street’s consensus estimates by 1.7%.
Looking ahead, sell-side analysts expect revenue to grow 5.2% over the next 12 months, according to S&P, a slight deceleration versus the last two years. Still, this projection is above average for the sector and suggests the market sees some success for its newer products and services.
Adjusted operating margin
Adjusted operating margin is one of the best measures of profitability because it tells us how much a company earns after subtracting all core expenses, such as marketing and R&D. It also removes various one-time costs to paint a better picture of normalized profits.
Broadridge has performed well over the last five years. It demonstrated high profitability for a business services company, with an average adjusted operating margin of 19.7%.
Looking at the trend in its profitability, Broadridge’s adjusted operating margin rose by 1.7 percentage points over the last five years, as its revenue growth gave it operating leverage.
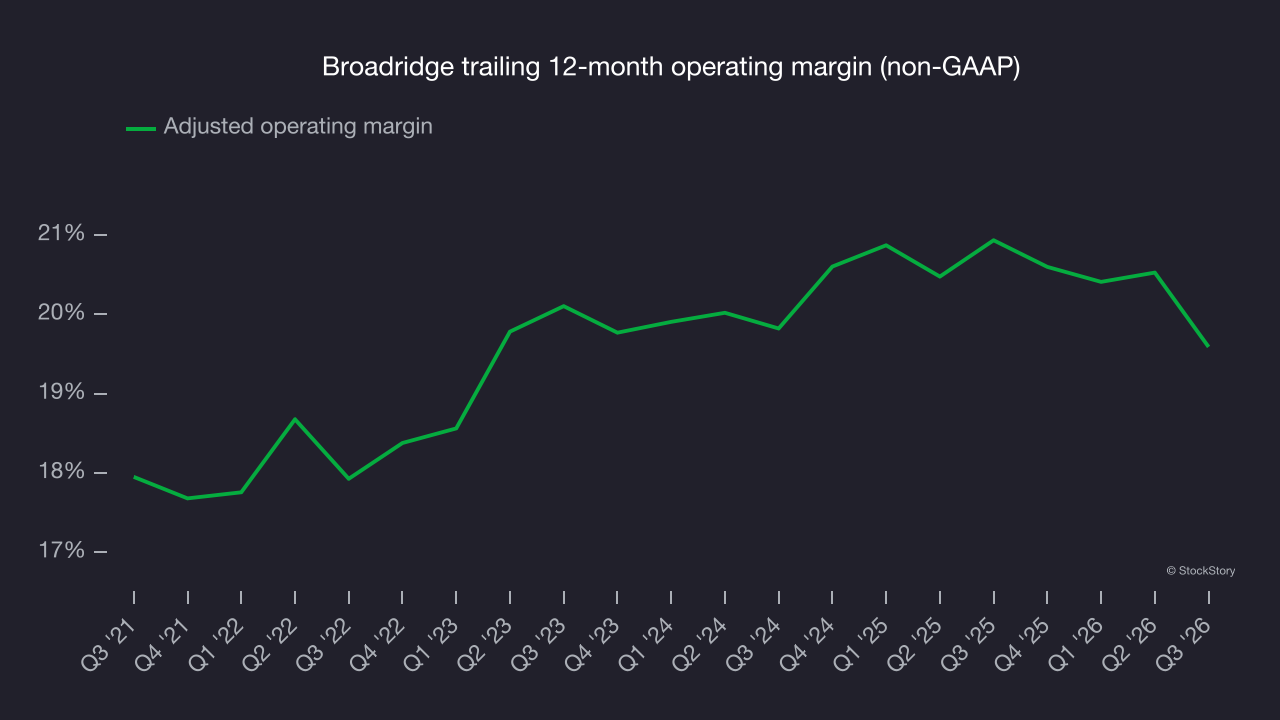
In Q3, Broadridge generated an adjusted operating margin of 11.8%, down 4 percentage points year on year. This contraction shows it was less efficient because its expenses grew faster than its revenue.
Earnings per share
We track the long-term change in earnings per share (EPS) for the same reason as long-term revenue growth. Compared to revenue, however, EPS highlights whether a company’s growth is profitable.
Broadridge’s EPS grew at an 11% compounded annual growth rate over the last five years, higher than its 7.9% annualized revenue growth. This indicates the company became more profitable on a per-share basis as it expanded.
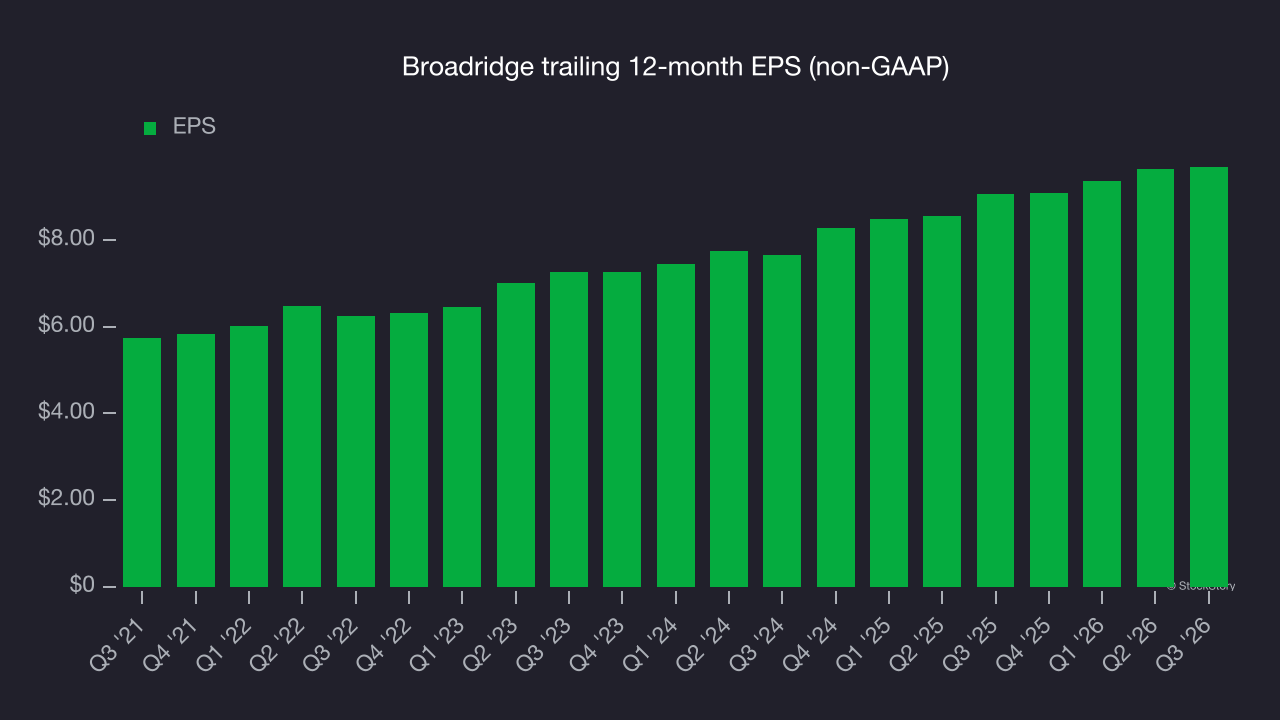
A closer look at Broadridge’s earnings helps explain its performance. As mentioned earlier, Broadridge’s adjusted operating margin declined this quarter but expanded by 1.7 percentage points over the last five years. Its share count also shrank by 3.4%, and these factors together are positive signs for shareholders because improving profitability and share buybacks boost EPS growth relative to revenue growth. 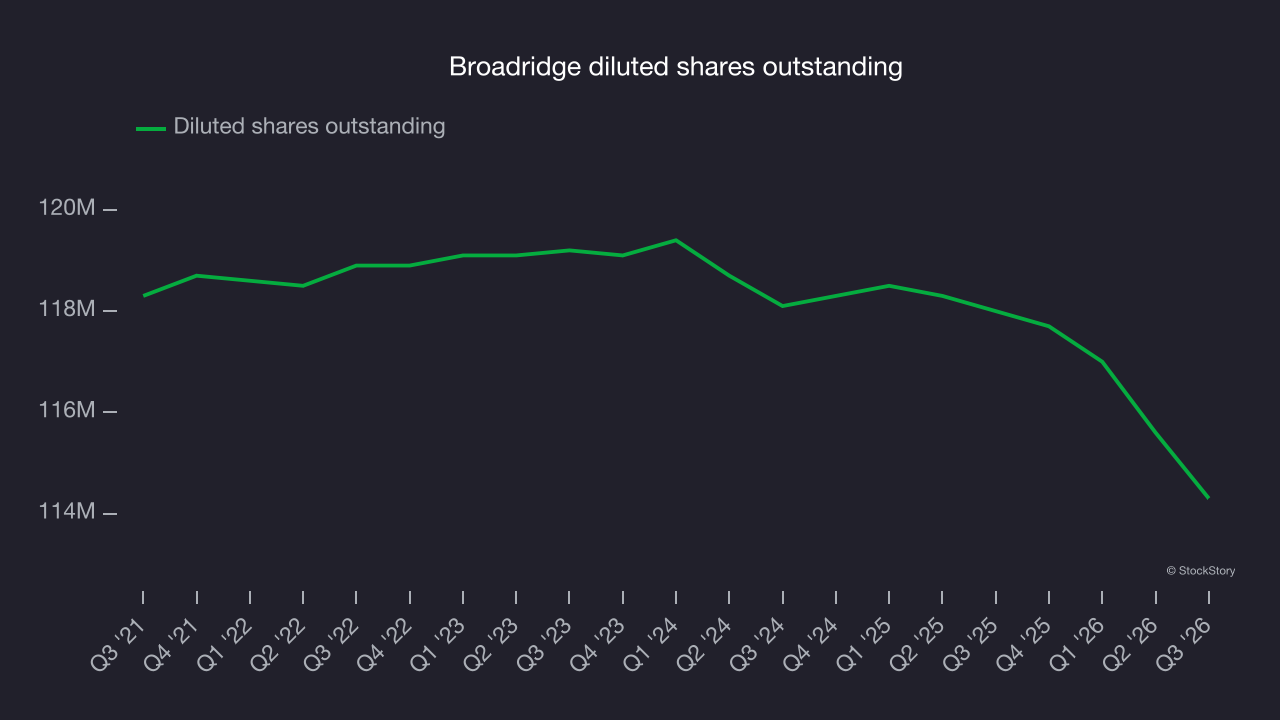
As with revenue, we analyze EPS over a shorter period to see if we are missing a change in the business.
For Broadridge, its two-year annual EPS growth of 12.5% was higher than its five-year trend. That acceleration is a positive sign, especially given the already high base.
In Q3, Broadridge reported adjusted EPS of $1.56, up from $1.51 in the same quarter last year. The result easily cleared analysts’ consensus estimates, a positive outcome for shareholders. Over the next 12 months, Wall Street expects Broadridge’s full-year EPS to grow 11.5% from $9.69 to $10.80, according to S&P.
Key takeaways from Broadridge’s Q3 results
Broadridge delivered some important positives in Q3, with EPS topping analysts’ consensus estimates and revenue also coming in ahead of Wall Street’s consensus. Shares remained flat at $182.49 immediately after the results.
When evaluating Broadridge as an investment, the latest quarter matters, but not as much as longer-term business quality and valuation. For more on Broadridge’s business quality and valuation, read the free full research report here.