Medical technology company Teleflex (NYSE: TFX) met Wall Street’s revenue expectations in Q3 2026, with revenue up 1.8% year on year to $567.8 million. Its non-GAAP profit of $2.63 per share was 39.1% above analysts’ consensus estimates.
For more on Teleflex, read our full research report, available free.
Teleflex (TFX) Q3 2026 highlights:
- Revenue $567.8 million vs S&P analysts’ consensus estimates of $565.3 million (1.8% year-on-year growth, in line)
- Adjusted EPS $2.63 vs S&P analysts’ consensus estimates of $1.89 (39.1% beat)
- Adjusted EPS guidance Management raised its full-year adjusted EPS guidance to $7.63 at the midpoint, an 8.2% increase
- Operating margin 18.6%, up from -73.3% in the same quarter last year
- Free cash flow margin 13.1%, similar to the same quarter last year
- Constant currency revenue rose 3% year on year (15.3% in the same quarter last year)
- Market capitalization $6.35 billion
“We are pleased with our third quarter performance, which included margin expansion and robust earnings per share growth, even when excluding IEEPA tariff refunds,” said Jason Weidman, Teleflex’s President and Chief Executive Officer. “Vascular and Surgical continued to deliver solid mid-single-digit growth, and Interventional improved, returning to modest growth. We made notable progress on the Interventional integration and strengthened the business’s leadership with the addition of Jason Fontana as President and General Manager. We also reached an important milestone in simplifying our operating model: we now manage and report as three global business units, Vascular, Interventional and Surgical. Reflecting our third quarter progress, we are raising our full-year adjusted earnings per share guidance.”
Revenue growth
Examining a company’s long-term performance can provide clues about its quality. Any business can experience short-term success, but top-performing ones enjoy sustained growth for years. Teleflex’s demand was weak over the last five years as its revenue fell at a 4% annual rate. That underwhelming result suggests it is a low-quality business.
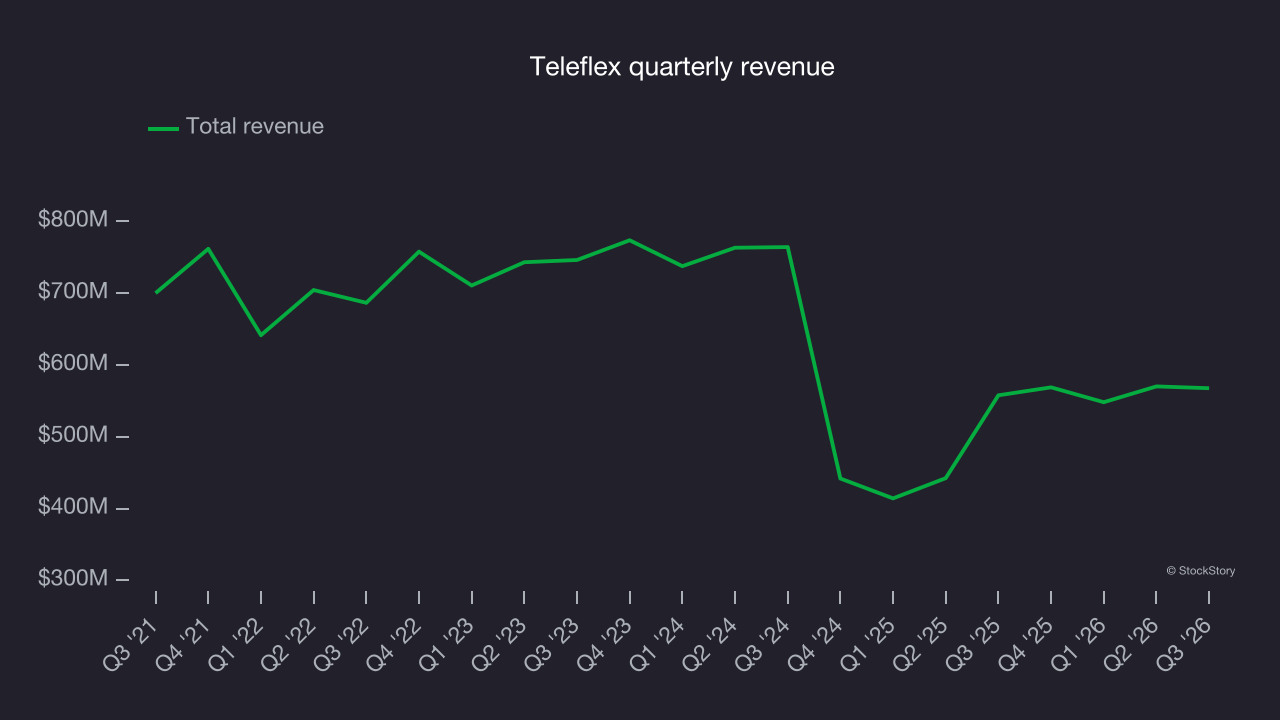
Long-term growth matters most, but within healthcare, a half-decade historical view may miss recent innovations or disruptive industry trends. Teleflex’s recent performance shows its demand remained suppressed as its revenue has declined by 13.9% annually over the last two years. 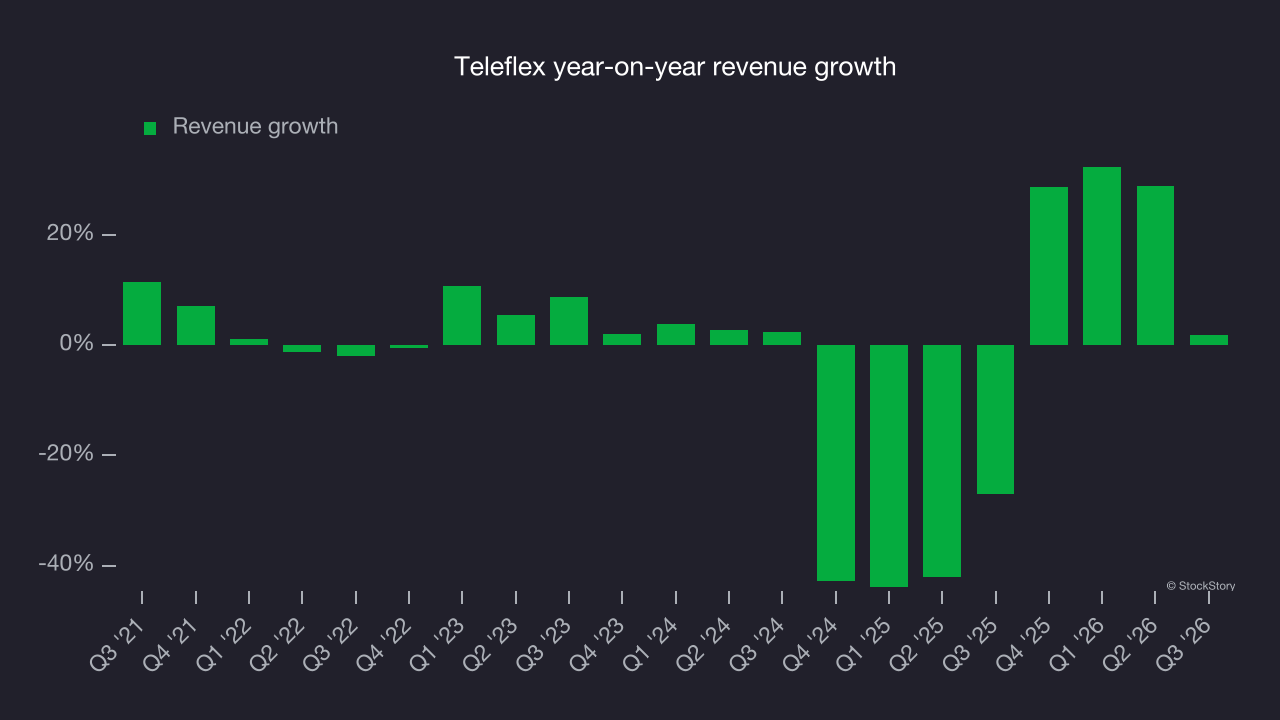
Analyzing the company’s constant currency revenue helps explain its revenue dynamics by excluding currency movements that are outside its control and not indicative of demand. Over the last two years, its constant currency revenue averaged 4.1% year-on-year growth. Constant currency growth outpaced reported revenue growth, indicating that foreign exchange rates have been a headwind for Teleflex. 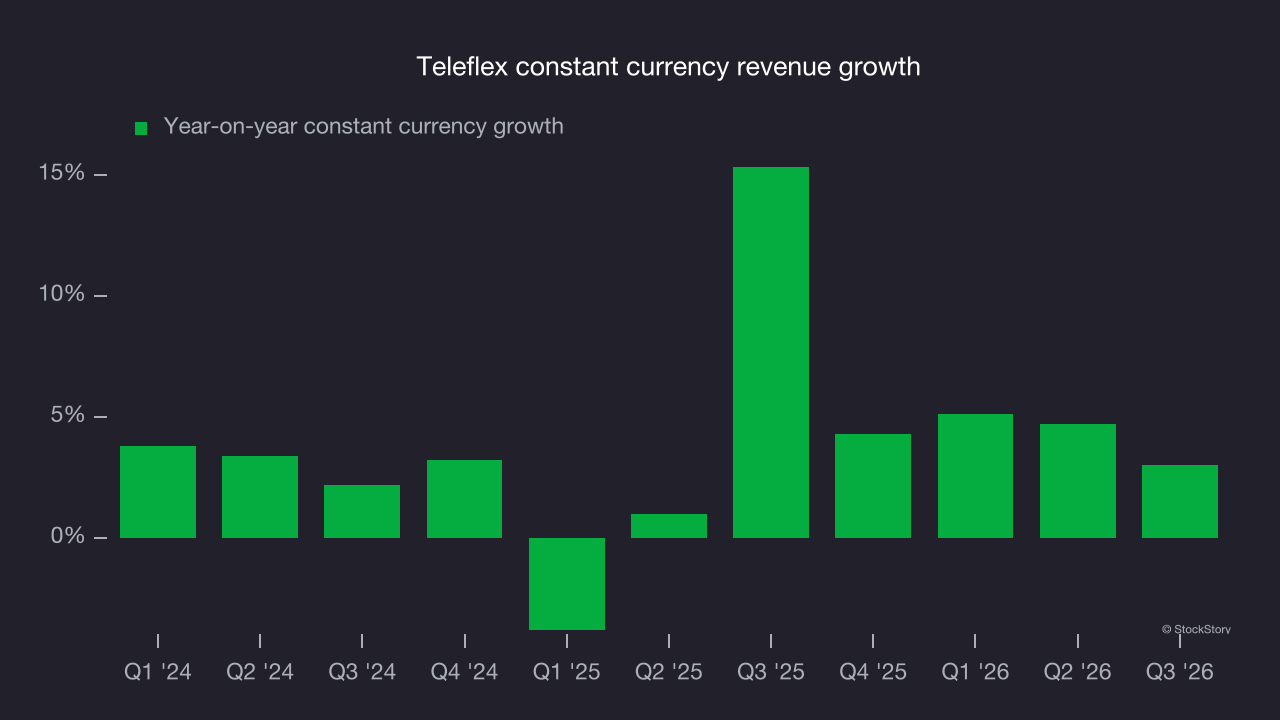
This quarter, Teleflex grew its revenue by 1.8% year on year, and its $567.8 million of revenue was in line with Wall Street’s consensus estimates.
Looking ahead, sell-side analysts expect revenue to grow 3.7% over the next 12 months, according to S&P. While this projection suggests its newer products and services will fuel better top-line performance, it is still below average for the sector.
Adjusted operating margin
Teleflex has been an efficient company over the last five years. It was one of the more profitable businesses in the healthcare sector, with an average adjusted operating margin of 25.2%.
Looking at the trend in its profitability, Teleflex’s adjusted operating margin decreased by 7.2 percentage points over the last five years. The company’s two-year trajectory also shows it failed to return to peak profitability as its margin fell by 7 percentage points. This was a poor performance, showing that its expenses were rising and it couldn’t pass those costs on to its customers.
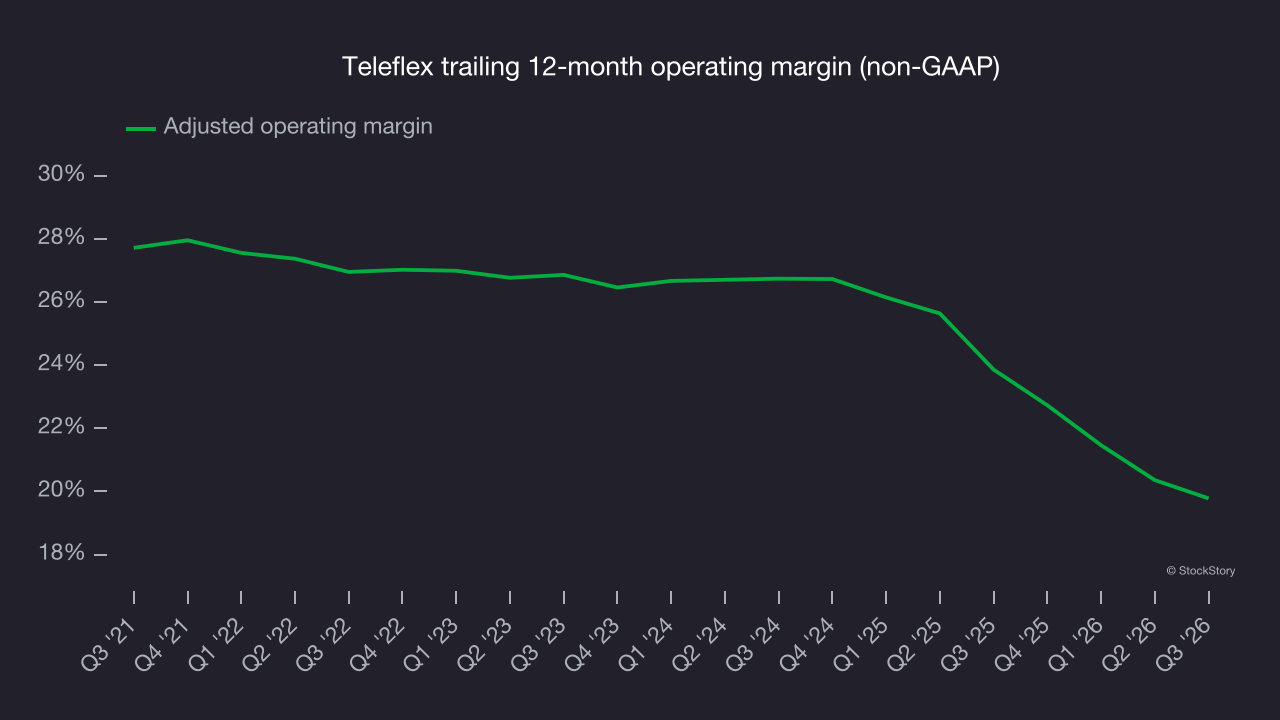
This quarter, Teleflex generated an adjusted operating margin of 19.7%, down 2.3 percentage points year on year. This contraction shows it was less efficient because its expenses grew faster than its revenue.
Earnings per share
Revenue trends explain a company’s historical growth, but the long-term change in earnings per share (EPS) points to the profitability of that growth. For example, a company could inflate its revenue through excessive spending on advertising and promotions.
Teleflex’s EPS declined by 9.9% annually over the last five years, more than its revenue. This indicates the company struggled because its fixed cost base made it difficult to adjust to shrinking demand.
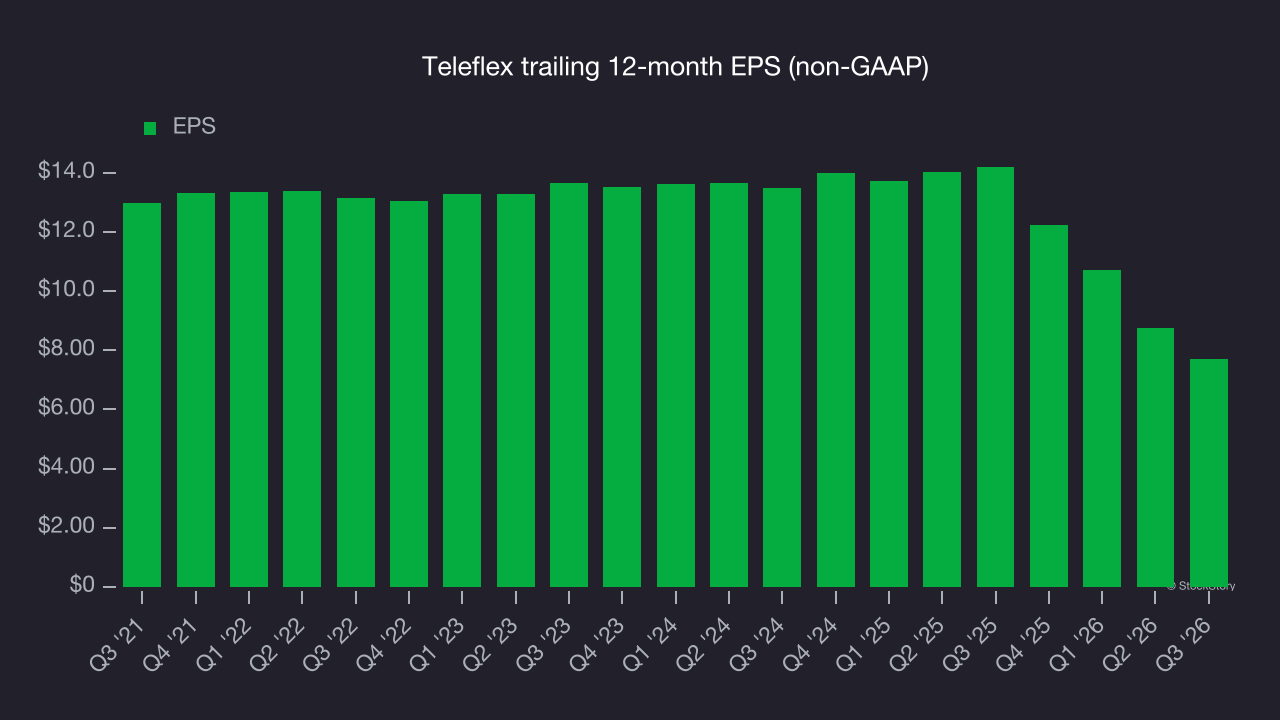
A closer look at Teleflex’s earnings helps explain its performance. As noted earlier, Teleflex’s adjusted operating margin declined by 7.2 percentage points over the last five years. This was the most relevant factor (aside from the revenue impact) behind its lower earnings; interest expenses and taxes can also affect EPS but reveal less about a company’s fundamentals.
In Q3, Teleflex reported adjusted EPS of $2.63, down from $3.67 in the same quarter last year. Despite falling year on year, the result came in well above analysts’ consensus estimates. Over the next 12 months, Wall Street expects Teleflex’s full-year EPS to grow 30.6% from $7.71 to $10.07, according to S&P.
Key takeaways from Teleflex’s Q3 results
Teleflex’s full-year EPS guidance came in well above Wall Street’s consensus estimates, adding to an EPS beat this quarter. Those were important positives in the results. Shares remained flat at $150.29 immediately after the release.
Teleflex reported solid earnings, but one quarter doesn’t necessarily make the stock a buy. An investment decision should also consider valuation and business quality. Read the full research report here (it’s free).