
Hotel and casino entertainment company Caesars Entertainment (NASDAQ: CZR) reported Q2 CY2026 results topping the market’s revenue expectations, with sales up 3% year on year to $2.99 billion. Its GAAP loss of $0.30 per share was significantly below analysts’ consensus estimates.
Is now the time to buy Caesars Entertainment? Find out by accessing our full research report, it’s free.
Caesars Entertainment (CZR) Q2 CY2026 Highlights:
- Revenue: $2.99 billion vs analyst estimates of $2.97 billion (3% year-on-year growth, 0.6% beat)
- EPS (GAAP): -$0.30 vs analyst estimates of $0.05 (significant miss)
- Adjusted EBITDA: $920 million vs analyst estimates of $962.7 million (30.7% margin, 4.4% miss)
- Operating Margin: 17.1%, in line with the same quarter last year
- Market Capitalization: $6.10 billion
Company Overview
Formerly Eldorado Resorts, Caesars Entertainment (NASDAQ: CZR) is a global gaming and hospitality company operating numerous casinos, hotels, and resort properties.
Revenue Growth
A company’s long-term performance is an indicator of its overall quality. Any business can put up a good quarter or two, but many enduring ones grow for years. Over the last five years, Caesars Entertainment grew its sales at a weak 10% compounded annual growth rate. This fell short of our benchmark for the consumer discretionary sector and is a poor baseline for our analysis.
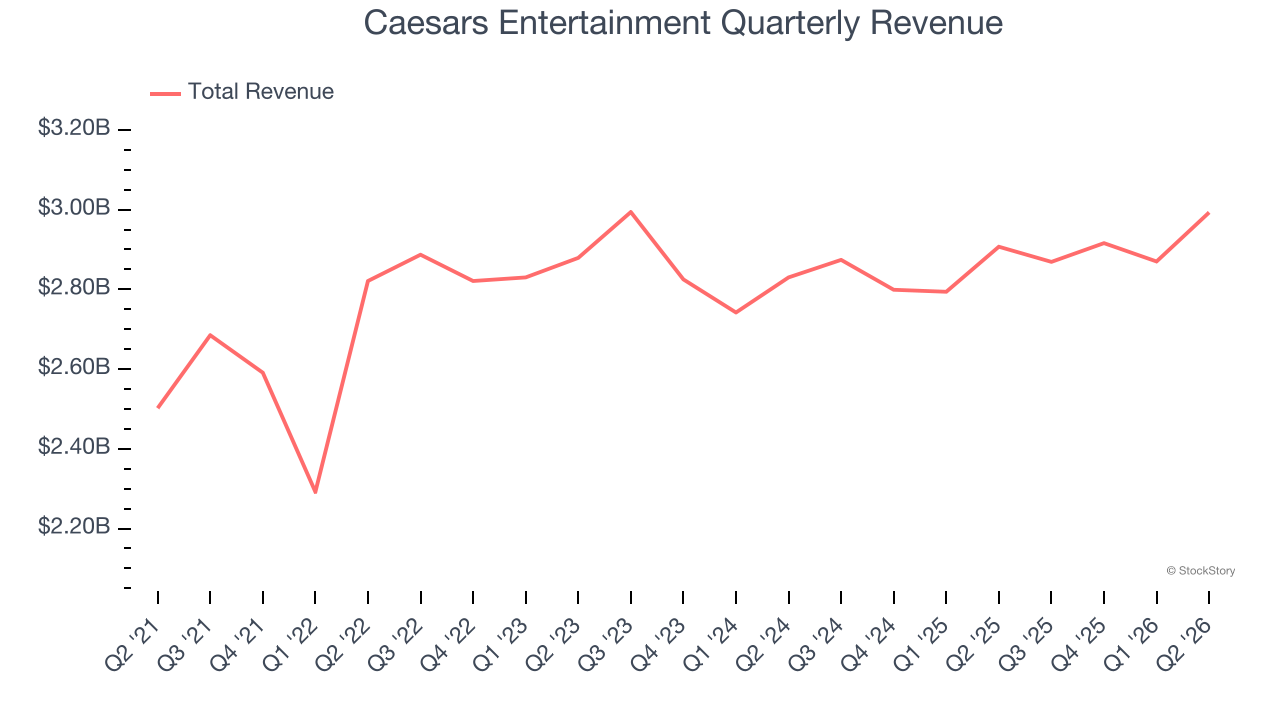
We at StockStory place the most emphasis on long-term growth, but within consumer discretionary, a stretched historical view may miss a company riding a successful new product or trend. Caesars Entertainment’s recent performance shows its demand has slowed as its annualized revenue growth of 1.1% over the last two years was below its five-year trend. We’re wary when companies in the sector see decelerations in revenue growth, as it could signal changing consumer tastes aided by low switching costs. Note that COVID hurt Caesars Entertainment’s business in 2020 and part of 2021, and it bounced back in a big way thereafter. 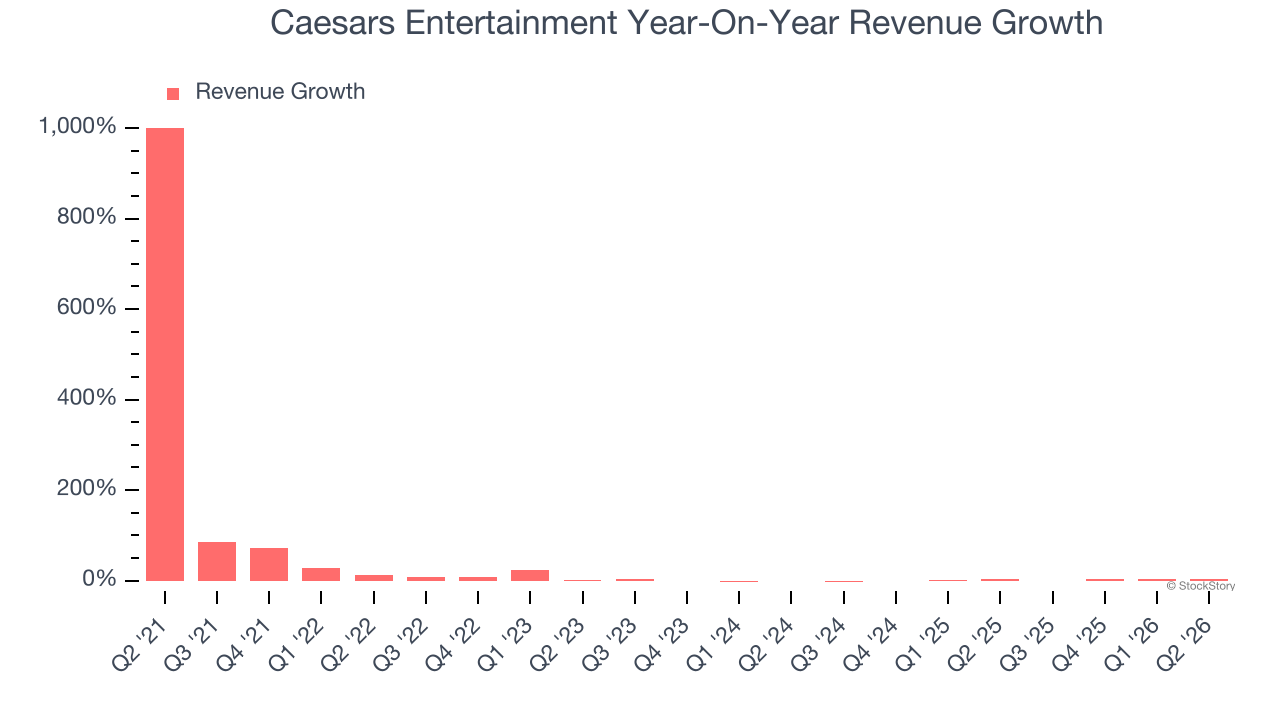
We can better understand the company’s revenue dynamics by analyzing its three most important segments: Casino, Hotel, and Dining, which are 58.8%, 14.2%, and 16.5% of revenue. Over the last two years, Caesars Entertainment’s Casino (Poker, Blackjack) and Dining (food and beverage) revenues averaged year-on-year growth of 14.9% and 8.6%. On the other hand, its Hotel revenue (overnight bookings) averaged 24.2% declines. 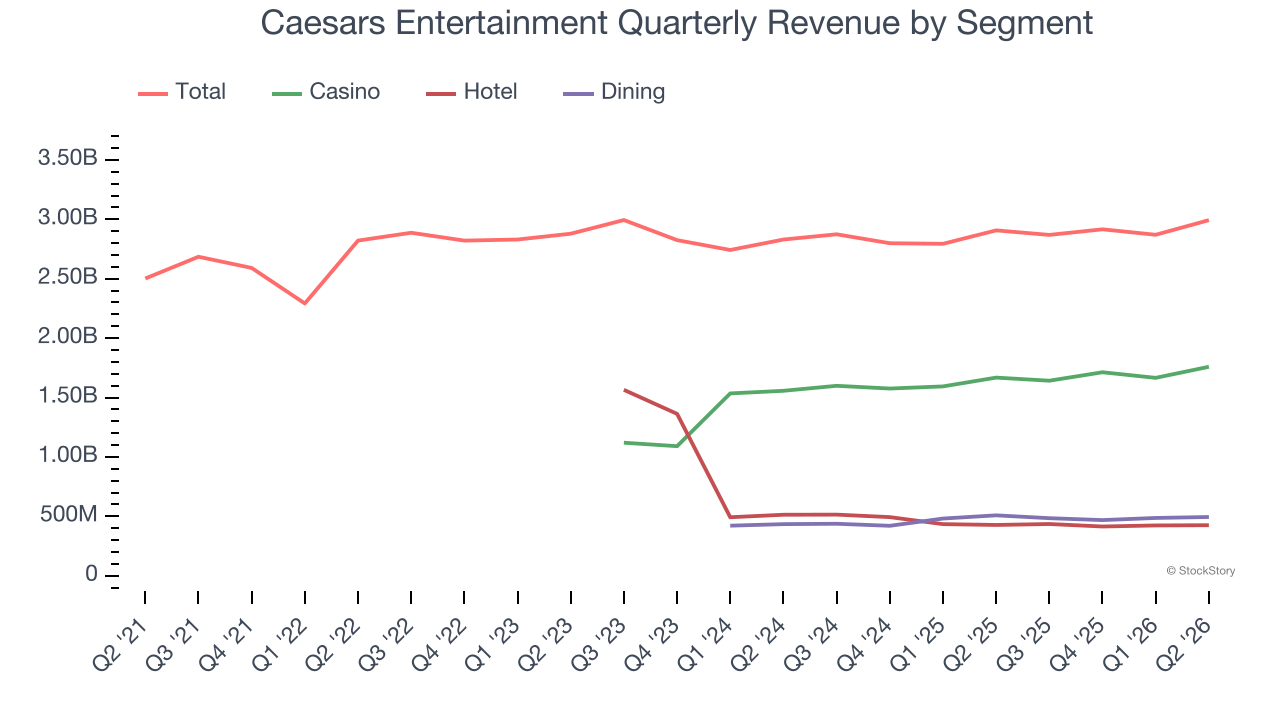
This quarter, Caesars Entertainment reported modest year-on-year revenue growth of 3% but beat Wall Street’s estimates by 0.6%.
Looking ahead, sell-side analysts expect revenue to grow 2.9% over the next 12 months. While this projection suggests its newer products and services will spur better top-line performance, it is still below the sector average.
ALSO WORTH WATCHING: Nvidia’s Quiet Partner. Nvidia’s chips cost a hundred grand. The connectors that make them work cost even more. One company makes them all.
Every AI server needs specialized infrastructure the chip companies don’t make. High-speed cables. Power connectors. Thermal sensors. This 90-year-old company built a monopoly on it. The AI boom just started. This stock is still flying under the radar. Claim The Stock Ticker Here for FREE.
Operating Margin
Caesars Entertainment’s operating margin has been trending down over the last 12 months and averaged 18.2% over the last two years. The company’s profitability was mediocre for a consumer discretionary business and shows it couldn’t pass its higher operating expenses onto its customers.
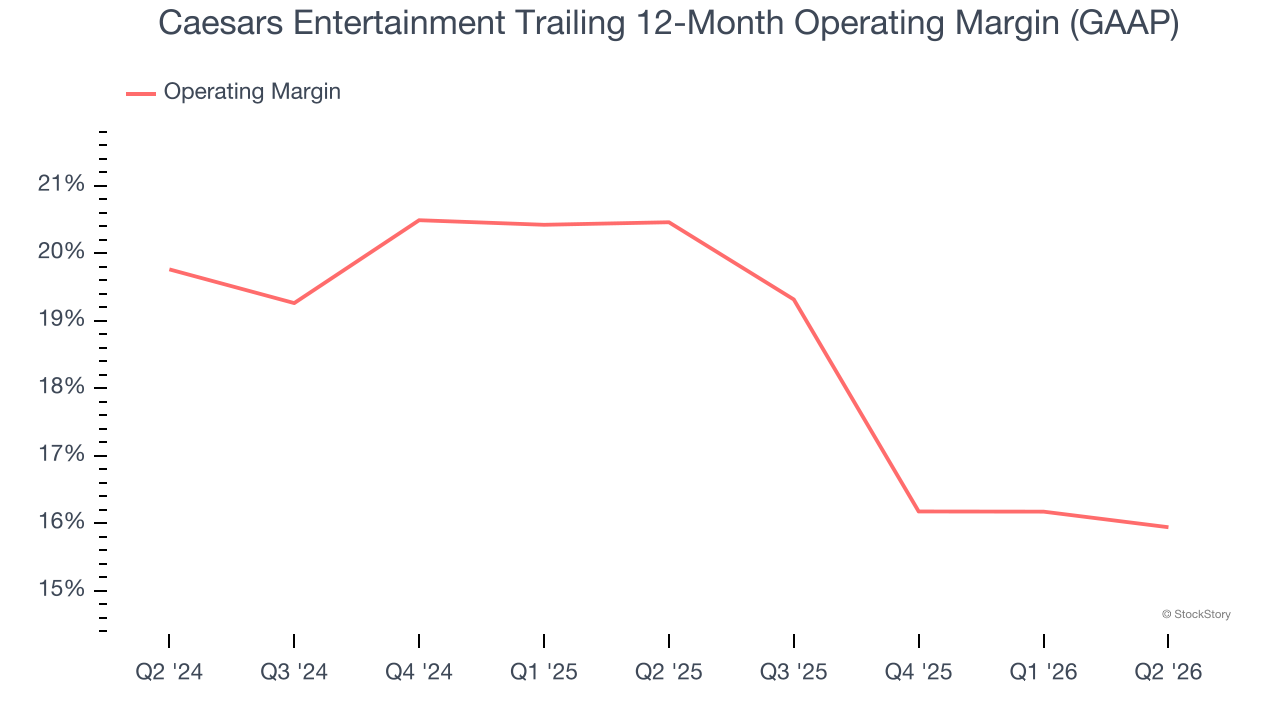
This quarter, Caesars Entertainment generated an operating margin profit margin of 17.1%, in line with the same quarter last year. This indicates the company’s overall cost structure has been relatively stable.
Earnings Per Share
We track the long-term change in earnings per share (EPS) for the same reason as long-term revenue growth. Compared to revenue, however, EPS highlights whether a company’s growth is profitable.
Although Caesars Entertainment’s full-year earnings are still negative, it reduced its losses and improved its EPS by 26.3% annually over the last five years. The next few quarters will be critical for assessing its long-term profitability.
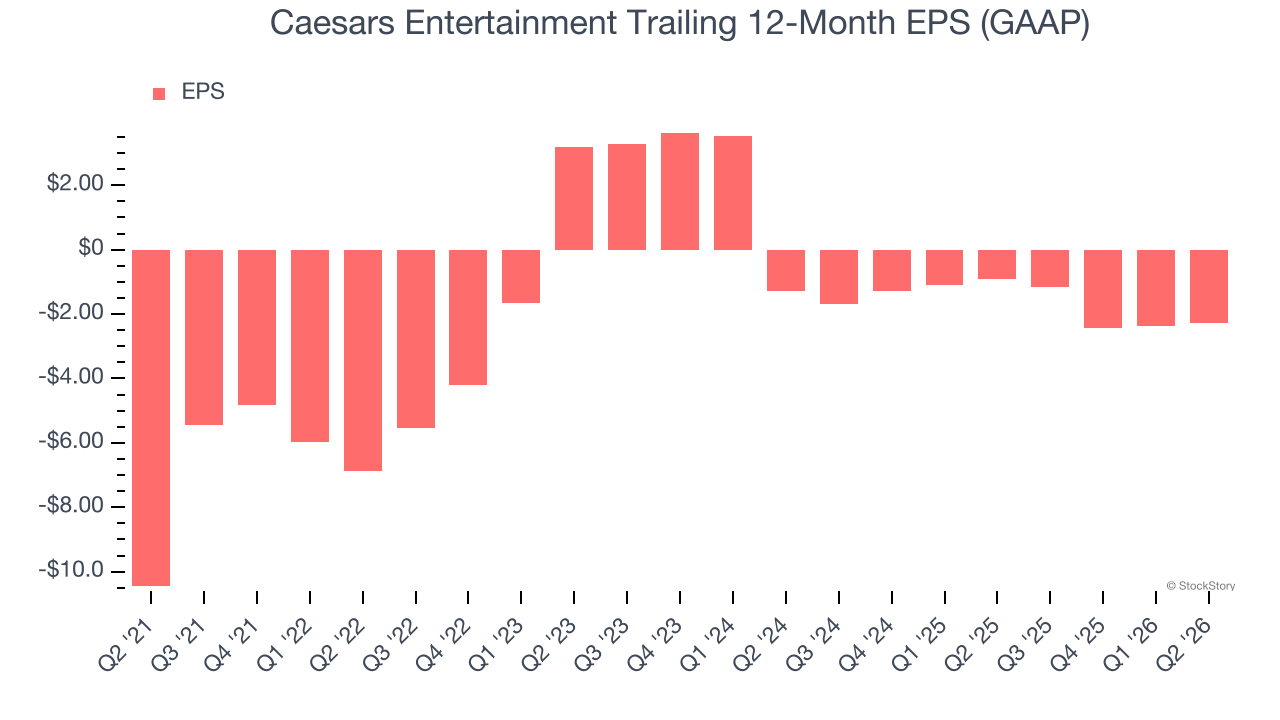
In Q2, Caesars Entertainment reported EPS of negative $0.30, up from negative $0.39 in the same quarter last year. Despite growing year on year, this print missed analysts’ estimates. Over the next 12 months, Wall Street is optimistic. Analysts forecast Caesars Entertainment’s full-year EPS will flip from negative $2.28 to positive $0.09.
Key Takeaways from Caesars Entertainment’s Q2 Results
We struggled to find many positives in these results. Its EPS missed and its EBITDA fell short of Wall Street’s estimates. Overall, this was a weaker quarter. The stock remained flat at $29.99 immediately after reporting.
So do we think Caesars Entertainment is an attractive buy at the current price? We think that the latest quarter is only one piece of the longer-term business quality puzzle. Quality, when combined with valuation, can help determine if the stock is a buy. We cover that in our actionable full research report which you can read here (it’s free).