Glass and electronic component manufacturer Corning (NYSE: GLW) missed Wall Street’s revenue expectations in Q2 CY2026, but sales rose 11.4% year on year to $4.51 billion. Next quarter’s revenue guidance of $4.95 billion underwhelmed, coming in 1.7% below analysts’ estimates. Its non-GAAP profit of $0.78 per share was 3.5% above analysts’ consensus estimates.
Is now the time to buy Corning? Find out by accessing our full research report, it’s free.
Corning (GLW) Q2 CY2026 Highlights:
- Revenue: $4.51 billion vs analyst estimates of $4.65 billion (11.4% year-on-year growth, 3% miss)
- Adjusted EPS: $0.78 vs analyst estimates of $0.75 (3.5% beat)
- Revenue Guidance for Q3 CY2026 is $4.95 billion at the midpoint, below analyst estimates of $5.04 billion
- Adjusted EPS guidance for Q3 CY2026 is $0.87 at the midpoint, above analyst estimates of $0.85
- Operating Margin: 15.5%, up from 14.2% in the same quarter last year
- Free Cash Flow Margin: 28.7%, up from 11.1% in the same quarter last year
- Market Capitalization: $123.4 billion
Wendell P. Weeks, chairman, chief executive officer, and president, said, “In the second quarter, we delivered outstanding results, and we upgraded our Springboard Plan to grow sales to an annualized run rate of $20 billion by the end of 2026, $30 billion by the end of 2028, and $40 billion by the end of 2030. We’re entering a new phase of accelerating growth, and we expect to deliver a sales CAGR of 19% from Q4 2026 to Q4 2030 – while growing earnings faster than sales, with significantly higher returns on invested capital and substantially more free cash flow.”
Company Overview
Supplying windows for some of the United States’s earliest spacecraft, Corning (NYSE: GLW) provides glass and other electronic components for the consumer electronics, telecommunications, automotive, and healthcare industries.
Revenue Growth
Examining a company’s long-term performance can provide clues about its quality. Any business can put up a good quarter or two, but the best consistently grow over the long haul. Over the last five years, Corning grew its sales at a mediocre 6% compounded annual growth rate. This wasn’t a great result compared to the rest of the industrials sector, but there are still things to like about Corning.
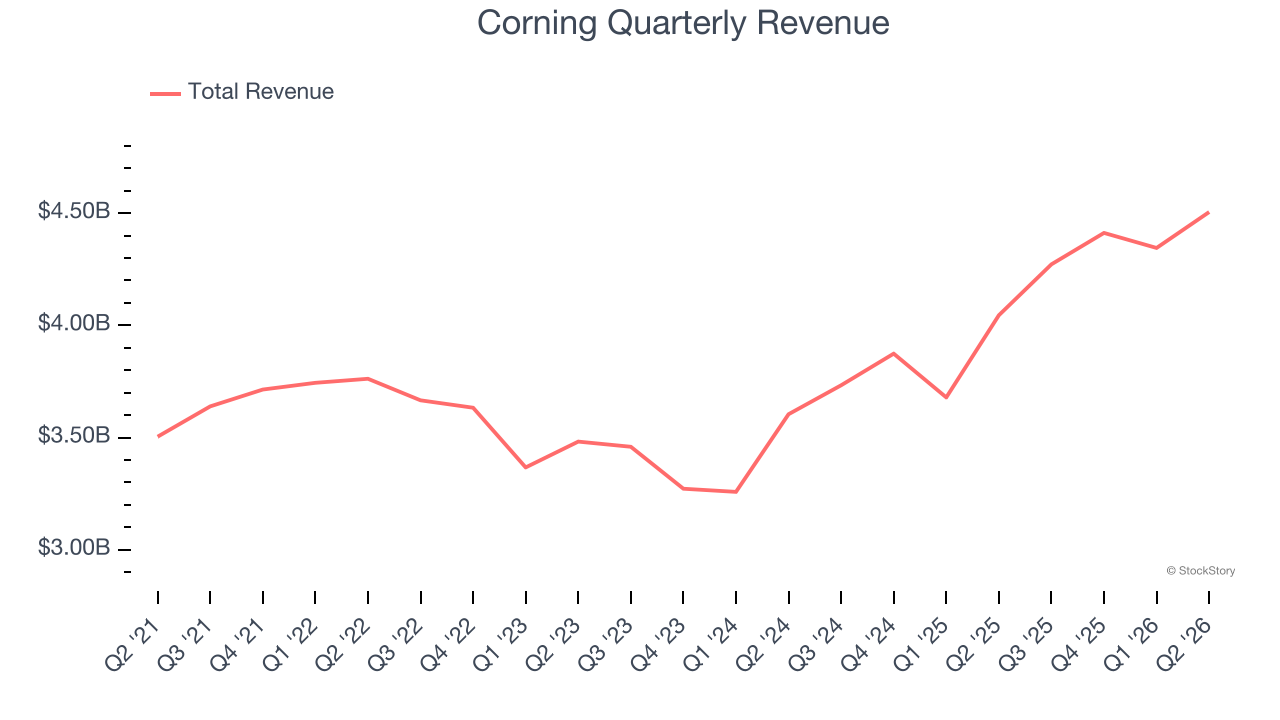
Long-term growth is the most important, but within industrials, a half-decade historical view may miss new industry trends or demand cycles. Corning’s annualized revenue growth of 13.6% over the last two years is above its five-year trend, suggesting its demand recently accelerated. 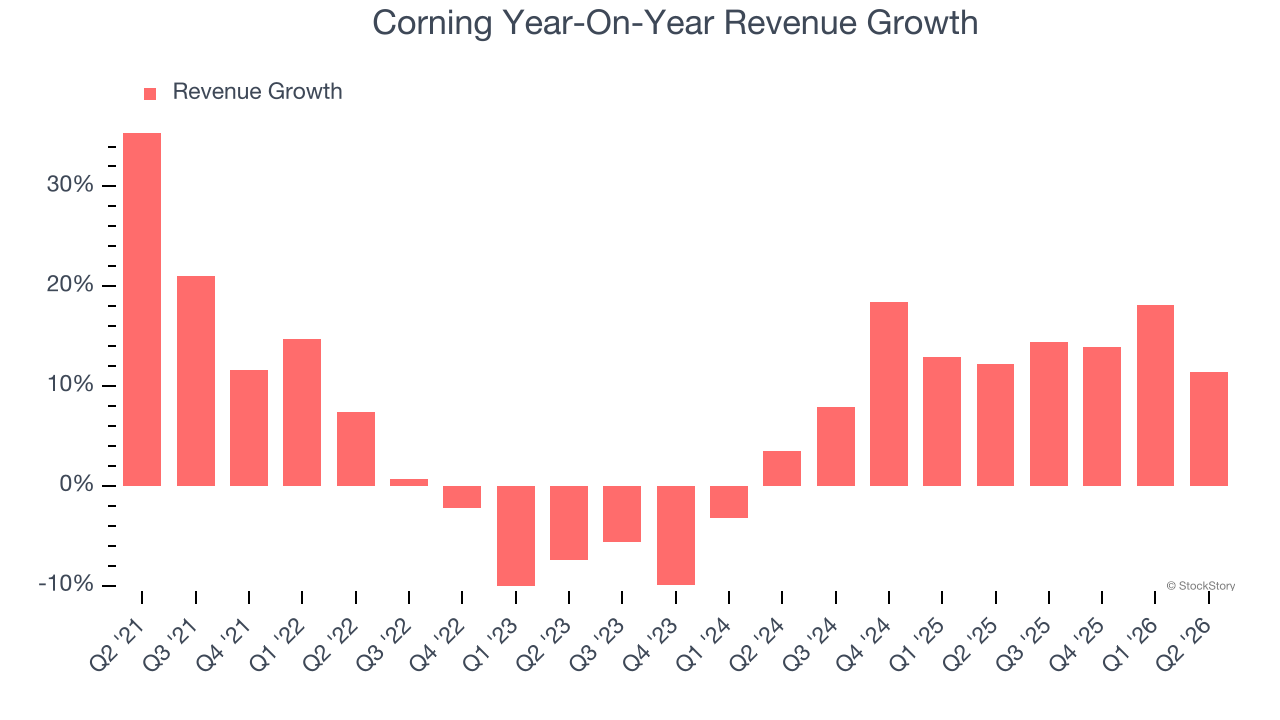
We can better understand the company’s revenue dynamics by analyzing its most important segments, Optical Communications and Display Technologies, which are 46% and 32.5% of revenue. Over the last two years, Corning’s Optical Communications revenue (optical fiber & cables) averaged 35.1% year-on-year growth while its Display Technologies revenue (glass for flat panel displays) averaged 9.2% growth. 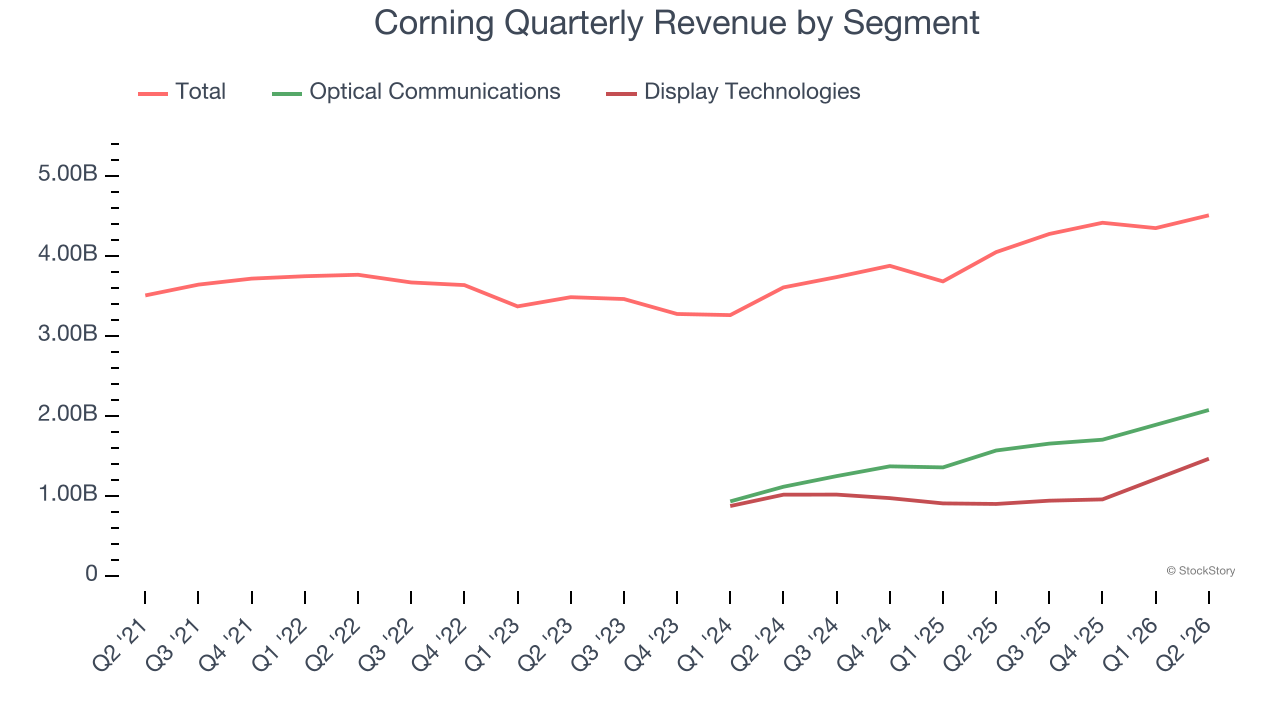
This quarter, Corning’s revenue grew by 11.4% year on year to $4.51 billion but fell short of Wall Street’s estimates. Company management is currently guiding for a 15.9% year-on-year increase in sales next quarter.
Looking further ahead, sell-side analysts expect revenue to grow 19.4% over the next 12 months, an improvement versus the last two years. This projection is eye-popping for a company of its scale and implies its newer products and services will spur better top-line performance.
ALSO WORTH WATCHING: Nvidia’s Quiet Partner. Nvidia’s chips cost a hundred grand. The connectors that make them work cost even more. One company makes them all.
Every AI server needs specialized infrastructure the chip companies don’t make. High-speed cables. Power connectors. Thermal sensors. This 90-year-old company built a monopoly on it. The AI boom just started. This stock is still flying under the radar. Claim The Stock Ticker Here for FREE.
Operating Margin
Corning’s operating margin has risen over the last 12 months and averaged 10.8% over the last five years. Its solid profitability for an industrials business shows it’s an efficient company that manages its expenses effectively. This result isn’t surprising as its high gross margin gives it a favorable starting point.
Analyzing the trend in its profitability, Corning’s operating margin might have fluctuated slightly but has generally stayed the same over the last five years. This raises questions about the company’s expense base because its revenue growth should have given it leverage on its fixed costs, resulting in better economies of scale and profitability.
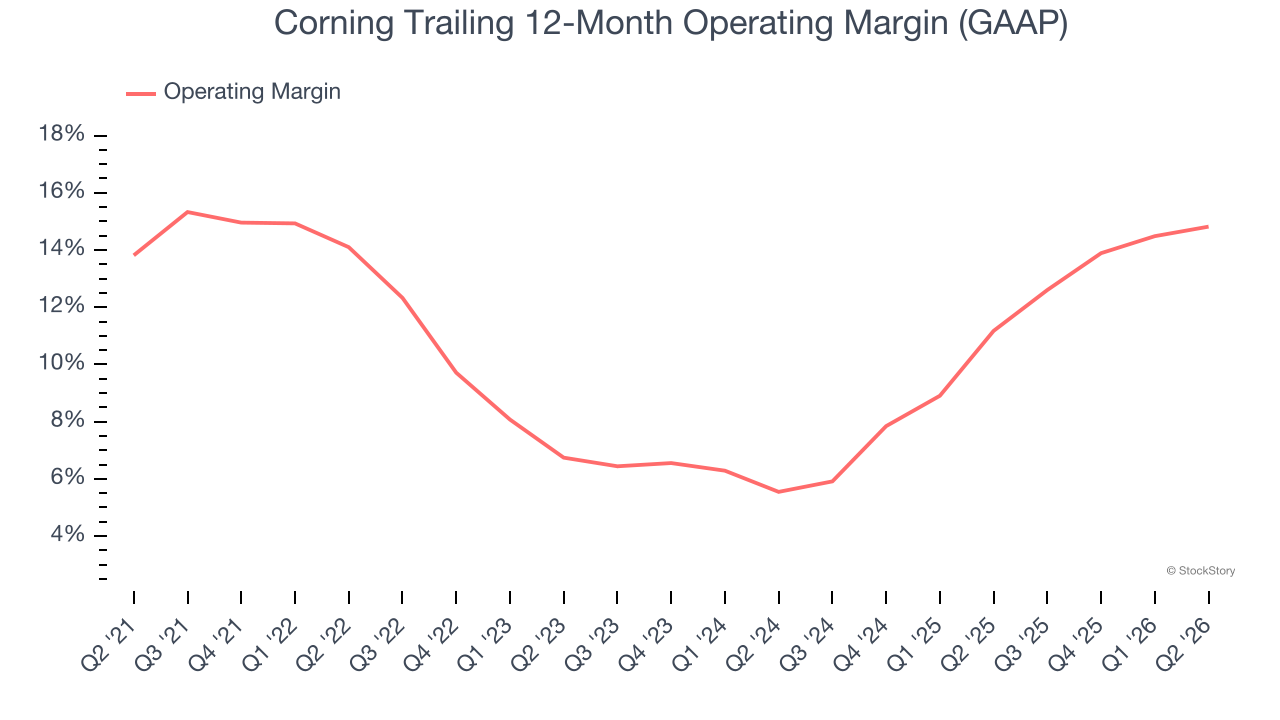
In Q2, Corning generated an operating margin profit margin of 15.5%, up 1.3 percentage points year on year. The increase was a welcome development and shows its expenses recently grew slower than its revenue, leading to higher efficiency.
Earnings Per Share
Revenue trends explain a company’s historical growth, but the long-term change in earnings per share (EPS) points to the profitability of that growth — for example, a company could inflate its sales through excessive spending on advertising and promotions.
Corning’s EPS grew at 8.3% compounded annual growth rate over the last five years, higher than its 6% annualized revenue growth. However, we take this with a grain of salt because its operating margin didn’t improve and it didn’t repurchase its shares, meaning the delta came from reduced interest expenses or taxes.
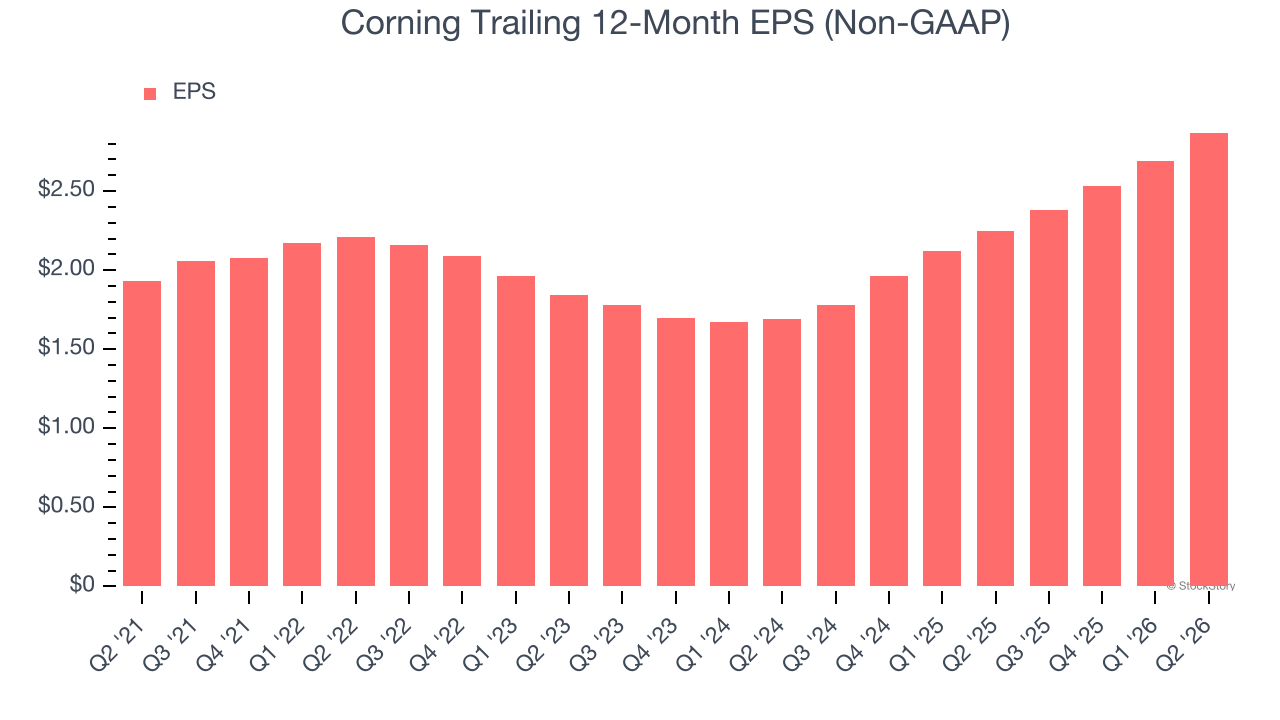
Like with revenue, we analyze EPS over a more recent period because it can provide insight into an emerging theme or development for the business.
Corning’s two-year annual EPS growth of 30.3% was fantastic and topped its 13.6% two-year revenue growth.
We can take a deeper look into Corning’s earnings quality to better understand the drivers of its performance. Corning’s operating margin has expanded over the last two years. This was the most relevant factor (aside from the revenue impact) behind its higher earnings; interest expenses and taxes can also affect EPS but don’t tell us as much about a company’s fundamentals.
In Q2, Corning reported adjusted EPS of $0.78, up from $0.60 in the same quarter last year. This print beat analysts’ estimates by 3.5%. Over the next 12 months, Wall Street expects Corning’s full-year EPS to grow 25.3% from $2.87 to $3.59.
Key Takeaways from Corning’s Q2 Results
It was encouraging to see Corning’s EPS guidance for next quarter beat analysts’ expectations. We were also glad its EPS outperformed Wall Street’s estimates. On the other hand, its revenue missed and its revenue guidance for next quarter fell short of Wall Street’s estimates. Overall, this was a weaker quarter. The stock traded down 16.1% to $120.62 immediately after reporting.
Corning didn’t show its best hand this quarter, but does that create an opportunity to buy the stock right now? What happened in the latest quarter matters, but not as much as longer-term business quality and valuation, when deciding whether to invest in this stock. We cover that in our actionable full research report which you can read here (it’s free).