
Real estate data provider CoStar Group (NASDAQ: CSGP) met Wall Street’s revenue expectations in Q2 CY2026, with sales up 18.4% year on year to $925 million. On the other hand, next quarter’s revenue guidance of $940 million was less impressive, coming in 2.9% below analysts’ estimates. Its non-GAAP profit of $0.32 per share was 11.9% above analysts’ consensus estimates.
Is now the time to buy CoStar? Find out by accessing our full research report, it’s free.
CoStar (CSGP) Q2 CY2026 Highlights:
- Revenue: $925 million vs analyst estimates of $928.9 million (18.4% year-on-year growth, in line)
- Adjusted EPS: $0.32 vs analyst estimates of $0.29 (11.9% beat)
- Adjusted EBITDA: $184 million vs analyst estimates of $173 million (19.9% margin, 6.3% beat)
- The company dropped its revenue guidance for the full year to $3.74 billion at the midpoint from $3.8 billion, a 1.7% decrease
- Management reiterated its full-year Adjusted EPS guidance of $1.36 at the midpoint
- EBITDA guidance for the full year is $800 million at the midpoint, below analyst estimates of $807.2 million
- Operating Margin: 8.2%, up from -3.5% in the same quarter last year
- Free Cash Flow was $140 million, up from -$5 million in the same quarter last year
- Market Capitalization: $11.91 billion
“The second quarter marked a profitability inflection point for CoStar Group as Adjusted EBITDA more than doubled year-over-year to $184 million. We held operating cost growth to just 2%, and we delivered our 61st consecutive quarter of double-digit revenue growth," said Andy Florance, Founder and Chief Executive Officer of CoStar Group.
Company Overview
With a research department that makes over 10,000 property updates daily to its 35-year-old database, CoStar Group (NASDAQ: CSGP) provides comprehensive real estate data, analytics, and online marketplaces for commercial and residential properties in the U.S. and U.K.
Revenue Growth
A company’s long-term sales performance is one signal of its overall quality. Any business can experience short-term success, but top-performing ones enjoy sustained growth for years.
With $3.56 billion in revenue over the past 12 months, CoStar is a mid-sized business services company, which sometimes brings disadvantages compared to larger competitors benefiting from better economies of scale. On the bright side, it can still flex high growth rates because it’s working from a smaller revenue base.
As you can see below, CoStar’s sales grew at an exceptional 14.5% compounded annual growth rate over the last five years. This shows it had high demand, a useful starting point for our analysis.
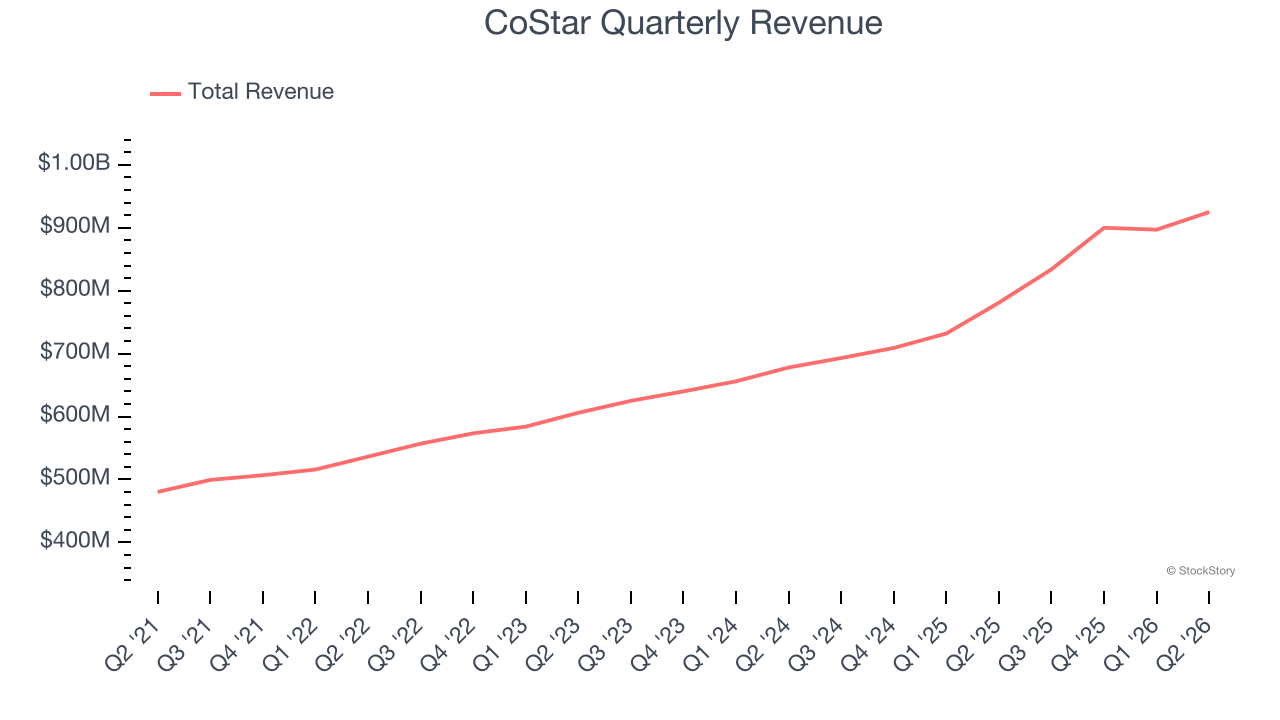
Long-term growth is the most important, but within business services, a half-decade historical view may miss new innovations or demand cycles. CoStar’s annualized revenue growth of 17% over the last two years is above its five-year trend, suggesting its demand was strong and recently accelerated. 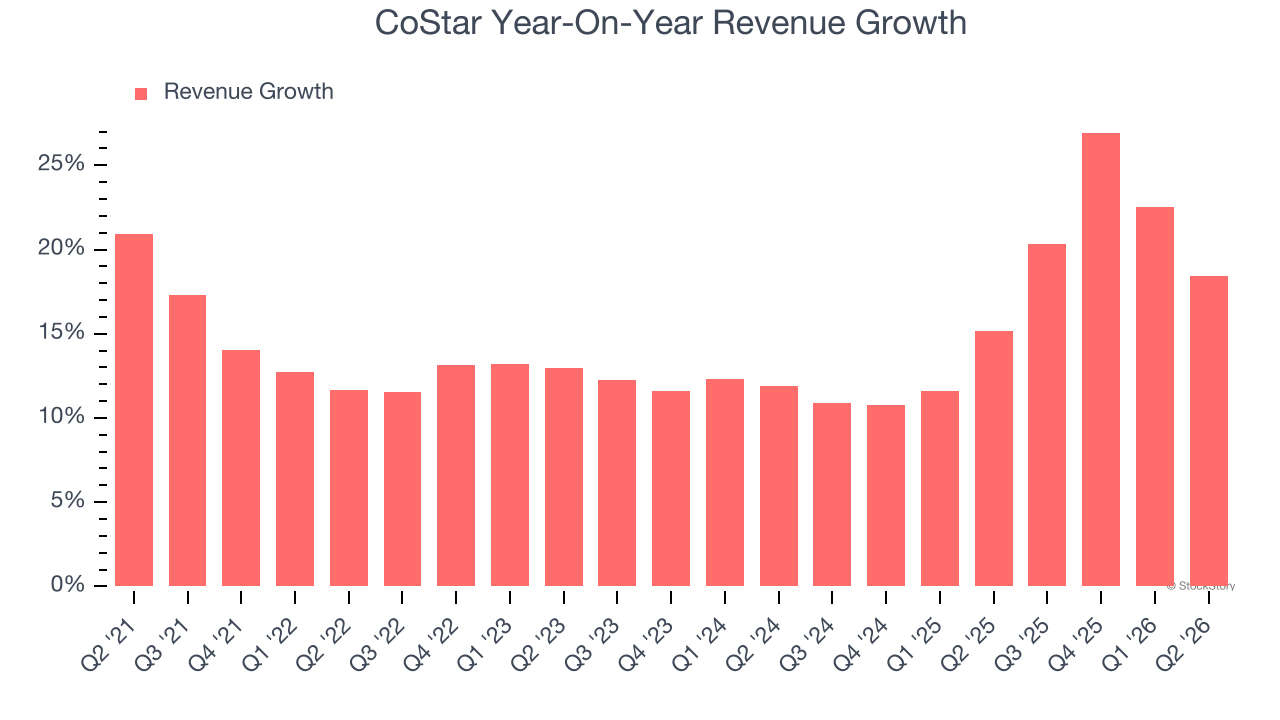
This quarter, CoStar’s year-on-year revenue growth was 18.4%, and its $925 million of revenue was in line with Wall Street’s estimates. Company management is currently guiding for a 12.7% year-on-year increase in sales next quarter.
Looking further ahead, sell-side analysts expect revenue to grow 13.1% over the next 12 months, a deceleration versus the last two years. Still, this projection is commendable and suggests the market sees success for its products and services.
WHILE YOU’RE HERE: The Next Palantir? One satellite company captures images of every point on Earth. Every single day. The Pentagon wants it. Hedge funds are using it to beat earnings. You’ve probably never heard of it.
This is what the early days of Palantir looked like before it became a giant. Same playbook. Different technology. If you missed Palantir, you need to see this. Claim The Stock Ticker for Free HERE.
Adjusted Operating Margin
Adjusted operating margin is an important measure of profitability as it shows the portion of revenue left after accounting for all core expenses — everything from the cost of goods sold to advertising and wages. It’s also useful for comparing profitability across companies because it excludes non-recurring expenses, interest on debt, and taxes.
CoStar has been an efficient company over the last five years. It was one of the more profitable businesses in the business services sector, boasting an average adjusted operating margin of 16.8%.
Analyzing the trend in its profitability, CoStar’s adjusted operating margin decreased by 17.8 percentage points over the last five years. This raises questions about the company’s expense base because its revenue growth should have given it leverage on its fixed costs, resulting in better economies of scale and profitability.
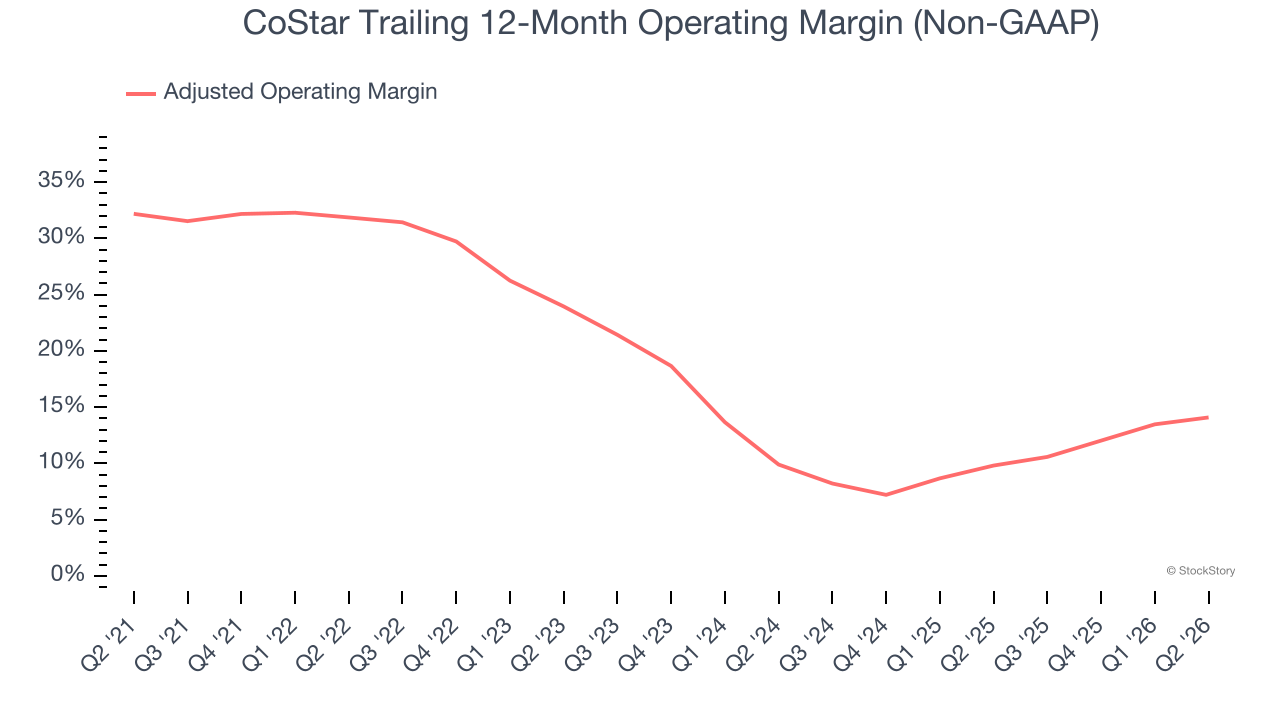
In Q2, CoStar generated an adjusted operating margin profit margin of 12.3%, up 3 percentage points year on year. This increase was a welcome development and shows it was more efficient.
Earnings Per Share
Revenue trends explain a company’s historical growth, but the long-term change in earnings per share (EPS) points to the profitability of that growth — for example, a company could inflate its sales through excessive spending on advertising and promotions.
CoStar’s flat EPS over the last five years was below its 14.5% annualized revenue growth. This tells us the company became less profitable on a per-share basis as it expanded.
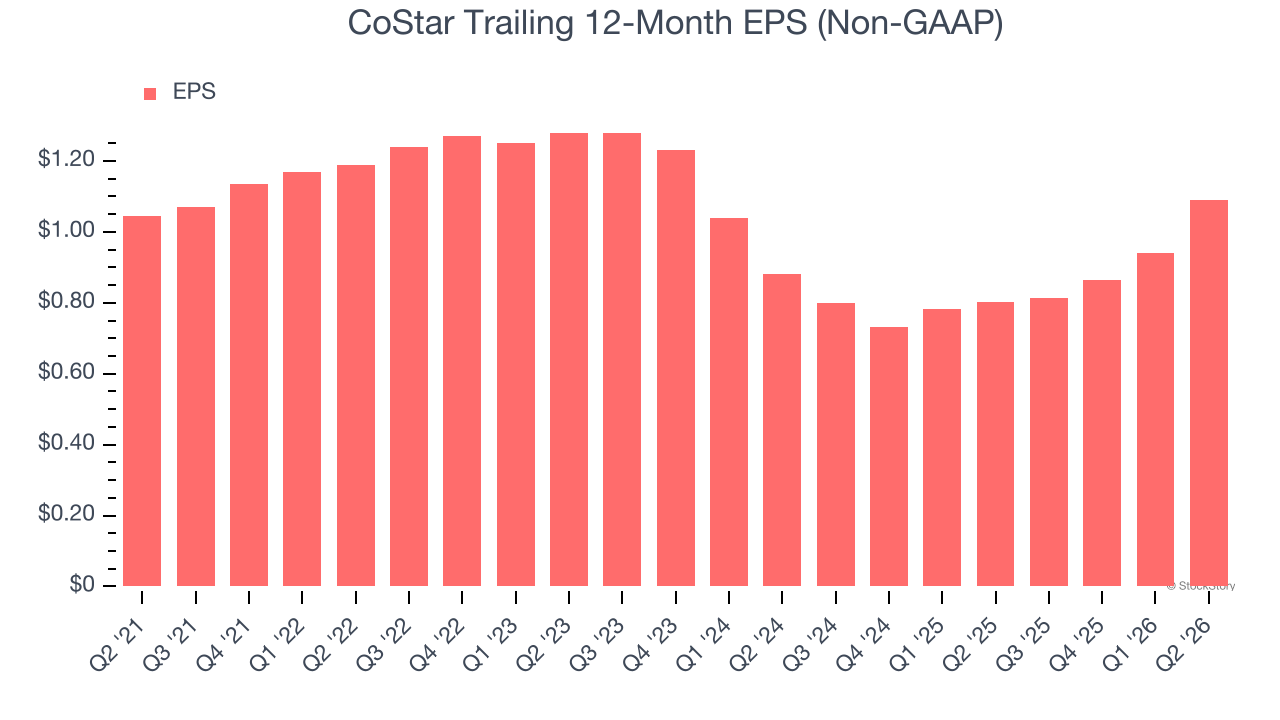
We can take a deeper look into CoStar’s earnings to better understand the drivers of its performance. As we mentioned earlier, CoStar’s adjusted operating margin expanded this quarter but declined by 17.8 percentage points over the last five years. Its share count also grew by 2.6%, meaning the company not only became less efficient with its operating expenses but also diluted its shareholders. 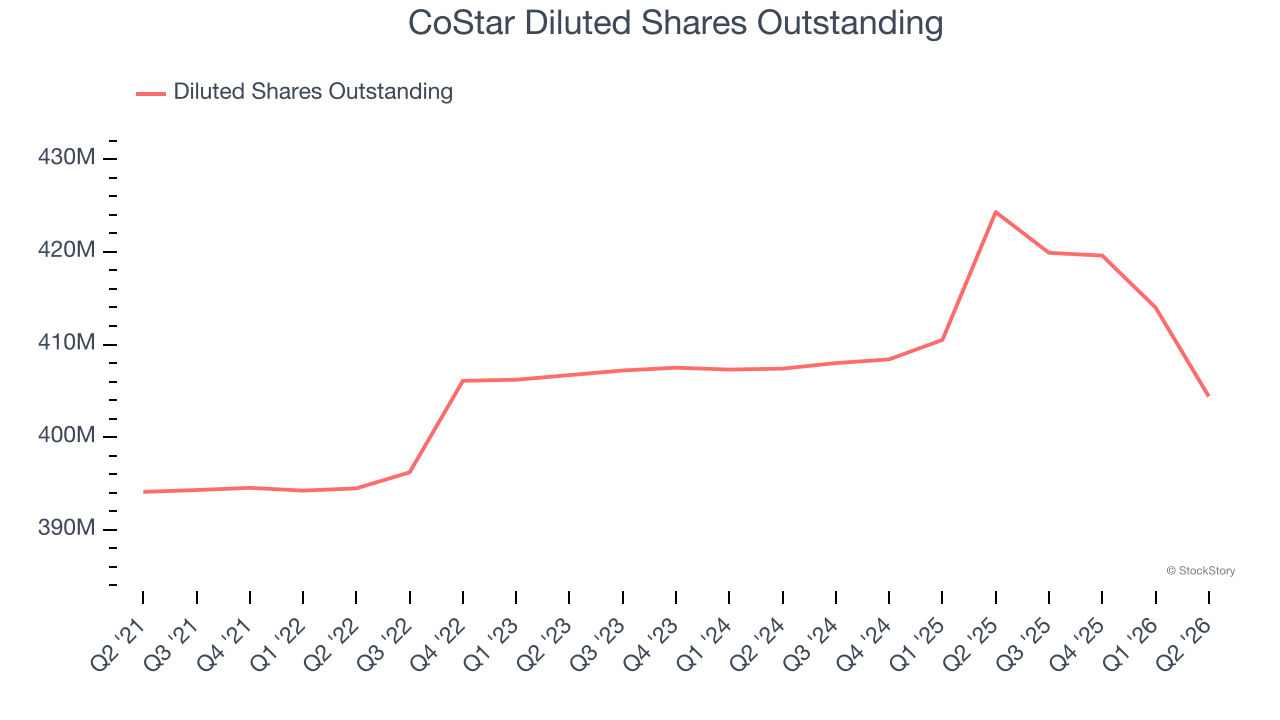
Like with revenue, we analyze EPS over a more recent period because it can provide insight into an emerging theme or development for the business.
For CoStar, its two-year annual EPS growth of 11.3% was higher than its five-year trend. Accelerating earnings growth is almost always an encouraging data point.
In Q2, CoStar reported adjusted EPS of $0.32, up from $0.17 in the same quarter last year. This print easily cleared analysts’ estimates, and shareholders should be content with the results. Over the next 12 months, Wall Street expects CoStar’s full-year EPS to grow 46.1% from $1.09 to $1.59.
Key Takeaways from CoStar’s Q2 Results
It was good to see CoStar beat analysts’ EPS expectations this quarter. On the other hand, its revenue guidance for next quarter missed and its EPS guidance for next quarter fell short of Wall Street’s estimates. Overall, this was a weaker quarter. The stock traded down 12% to $26.71 immediately after reporting.
CoStar didn’t show its best hand this quarter, but does that create an opportunity to buy the stock right now? When making that decision, it’s important to consider its valuation, business qualities, as well as what has happened in the latest quarter. We cover that in our actionable full research report which you can read here (it’s free).