Over the past six months, General Mills’s stock price fell to $36.58. Shareholders have lost 6.2% of their capital, which is disappointing considering the S&P 500 has climbed by 13.7%. This may have investors wondering how to approach the situation.
Is now the time to buy General Mills, or should you be careful about including it in your portfolio? See what our analysts have to say in our full research report, it’s free.
Why Do We Think General Mills Will Underperform?
Even though the stock has become cheaper, we’re sitting this one out for now. Here are three reasons you should be careful with GIS, plus one stock we’d rather own.
1. Demand Slipping as Sales Volumes Decline
Revenue growth can be broken down into changes in price and volume (the number of units sold). While both are important, volume is the lifeblood of a successful staples business as there’s a ceiling to what consumers will pay for everyday goods; they can always trade down to non-branded products if the branded versions are too expensive.
General Mills’s average quarterly sales volumes have shrunk by 4.4% over the last two years. This decrease isn’t ideal because the quantity demanded for consumer staples products is typically stable. 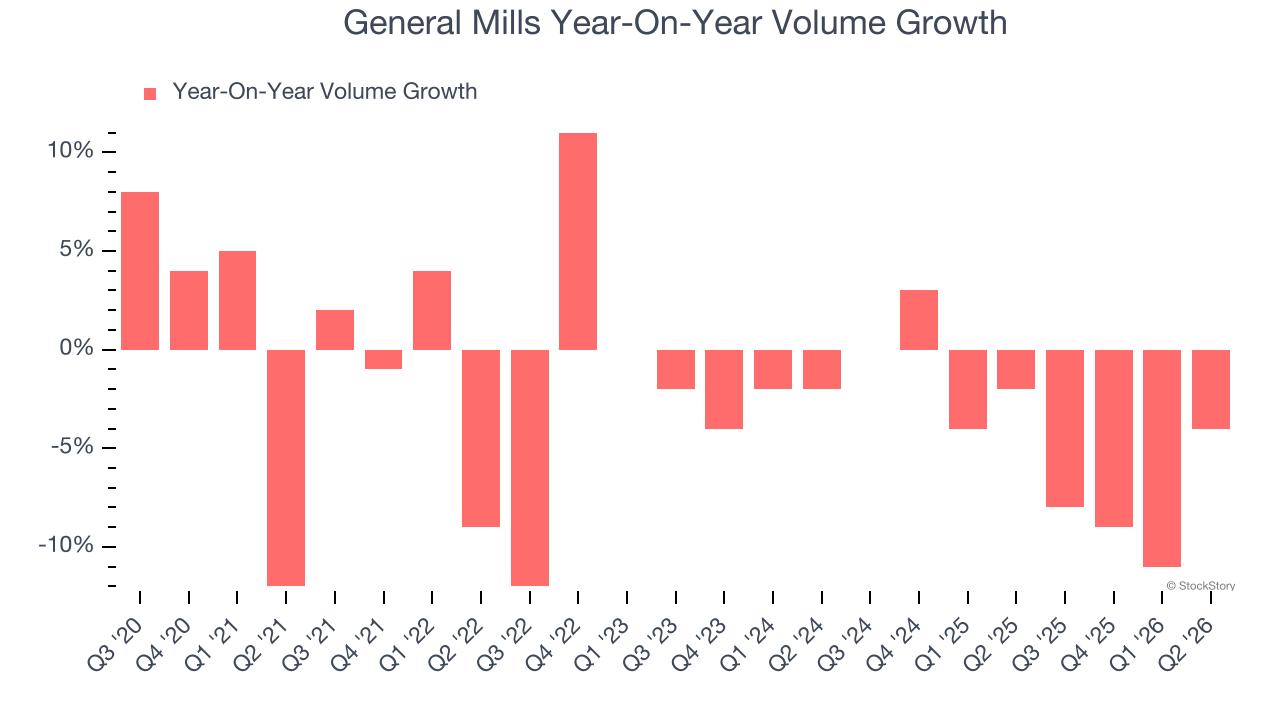
2. Revenue Projections Show Stormy Skies Ahead
Forecasted revenues by Wall Street analysts signal a company’s potential. Predictions may not always be accurate, but accelerating growth typically boosts valuation multiples and stock prices while slowing growth does the opposite.
Over the next 12 months, sell-side analysts expect General Mills’s revenue to drop by 3.5%, close to its 2.9% annualized declines for the past three years. This projection is underwhelming and suggests its newer products will not catalyze better top-line performance yet.
3. Shrinking Operating Margin
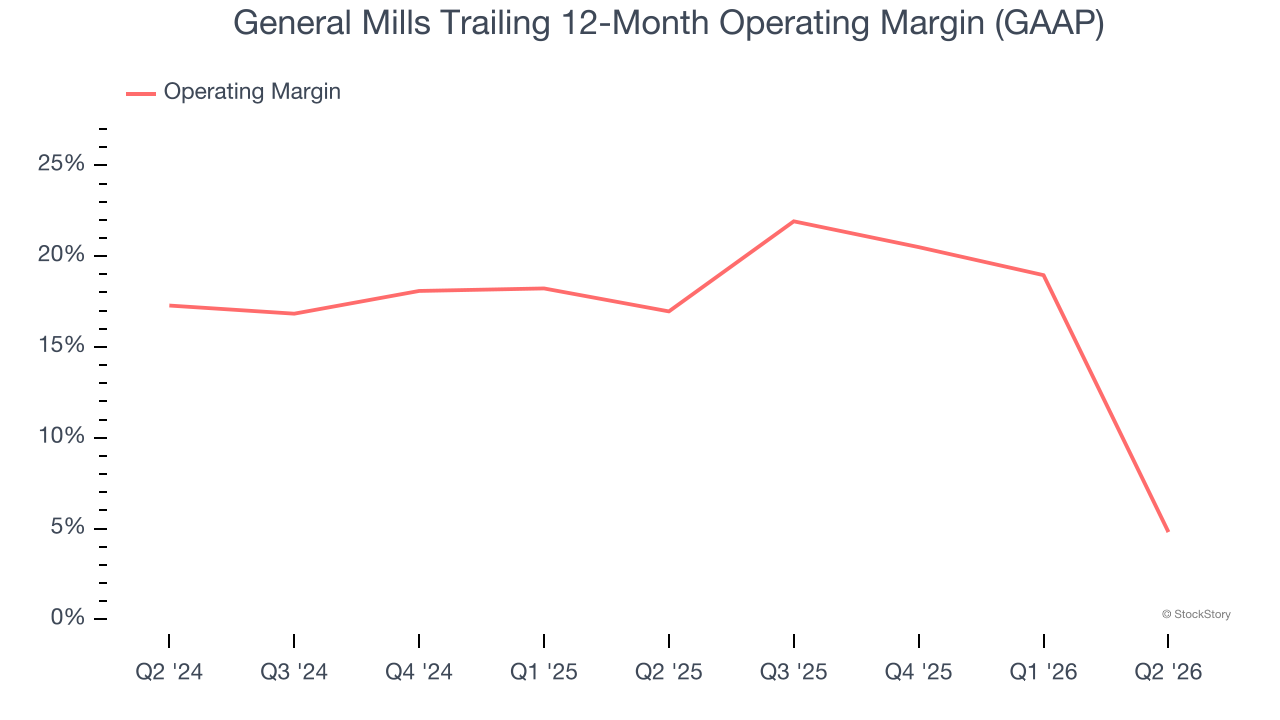
Operating margin is an important measure of profitability as it shows the portion of revenue left after accounting for all core expenses — everything from the cost of goods sold to advertising and wages. It’s also useful for comparing profitability across companies with different levels of debt and tax rates because it excludes interest and taxes.
Analyzing the trend in its profitability, General Mills’s operating margin decreased by 12.2 percentage points over the last year. Even though its historical margin was healthy, shareholders will want to see General Mills become more profitable in the future. Its operating margin for the trailing 12 months was 4.8%.
Final Judgment
General Mills falls short of our quality standards. Following the recent decline, the stock trades at 11.9× forward P/E (or $36.58 per share). This valuation multiple is fair, but we don’t have much confidence in the company. There are better stocks to buy right now. Let us point you toward one of our top software and edge computing picks.
Stocks We Would Buy Instead of General Mills
WHILE YOU’RE HERE: Top 9 Market-Beating Stocks. The best stocks don’t just beat the market once. They do it again. And again. Robust revenue growth, rising free cash flow, returns on capital that leave their competition in the dust. The market has already rewarded these businesses.
But our AI platform says the party isn’t over. Find out which 9 stocks made the cut this week — FREE. Get Our Top 9 Market-Beating Stocks for Free HERE.
Stocks that have made our list include now familiar names such as Nvidia (+1,460% between June 2020 and June 2025) as well as under-the-radar businesses like the once-small-cap company Comfort Systems (+1,154% between June 2020 and June 2025). Find your next big winner with StockStory today.