Insurance services company CNO Financial Group (NYSE: CNO) announced better-than-expected revenue in Q3 2026, with revenue up 12.6% year on year to $1.09 billion. Its non-GAAP profit of $1.42 per share was 28.8% above analysts’ consensus estimates.
For more on CNO Financial Group, read our free full research report.
CNO Financial Group (CNO) Q3 2026 highlights:
- Revenue $1.09 billion vs S&P analysts’ consensus estimates of $1.01 billion (12.6% year-on-year growth, 7.7% beat)
- Pre-tax profit $226.4 million (20.8% margin)
- Adjusted EPS $1.42 vs S&P analysts’ consensus estimates of $1.10 (28.8% beat)
- Book value per share $25.34 (7% year-on-year decline)
- Market capitalization $5.03 billion
"Our momentum reflects disciplined execution across the business and continued improvement in profitability. Based on these results, we are raising our full-year operating earnings per share guidance. We also executed our 3rd reinsurance transaction with our Bermuda affiliate, supporting our focus on serving middle-income households. We remain committed to driving sustained, profitable growth and creating long-term value for our shareholders."
Revenue growth
Insurance companies earn revenue from three primary sources: 1) The core insurance business itself, often called underwriting and represented in the income statement as premiums 2) Income from investing the “float” (premiums collected upfront not yet paid out as claims) in assets such as fixed-income assets and equities 3) Fees from various sources such as policy administration, annuities or other value-added services. CNO Financial Group’s 2.4% annualized revenue growth over the last five years was sluggish, falling short of our benchmarks.
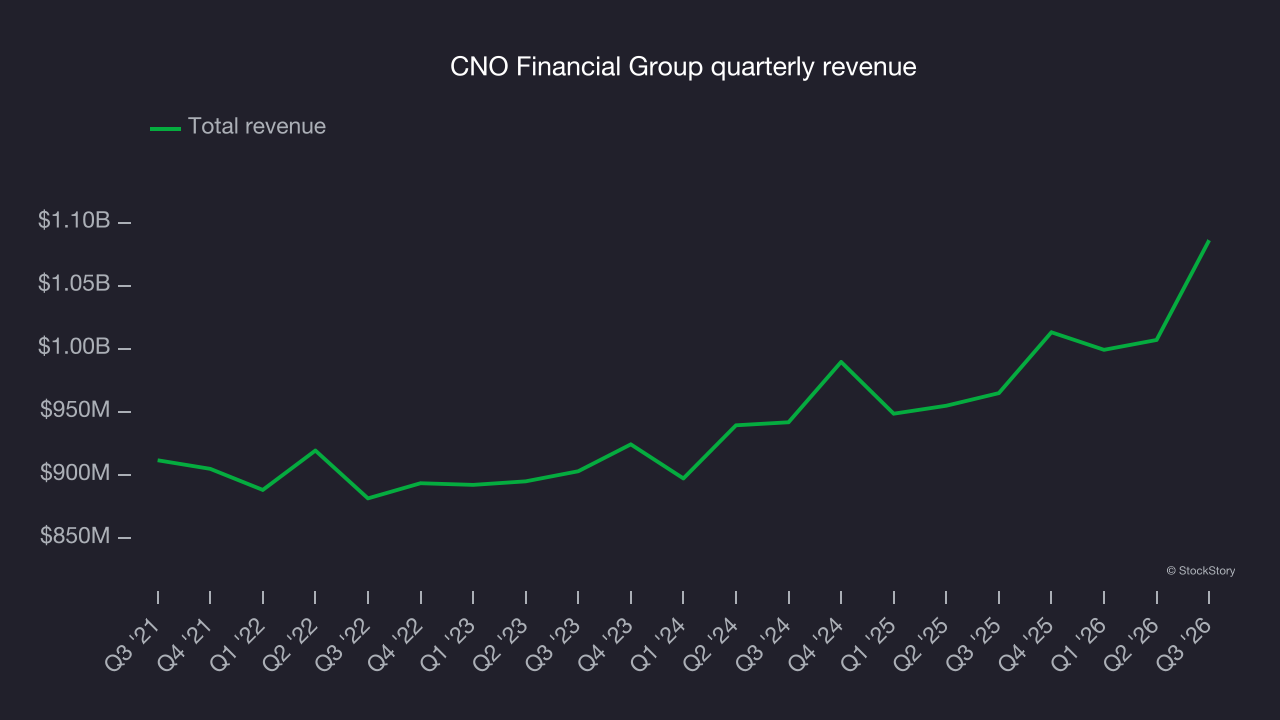
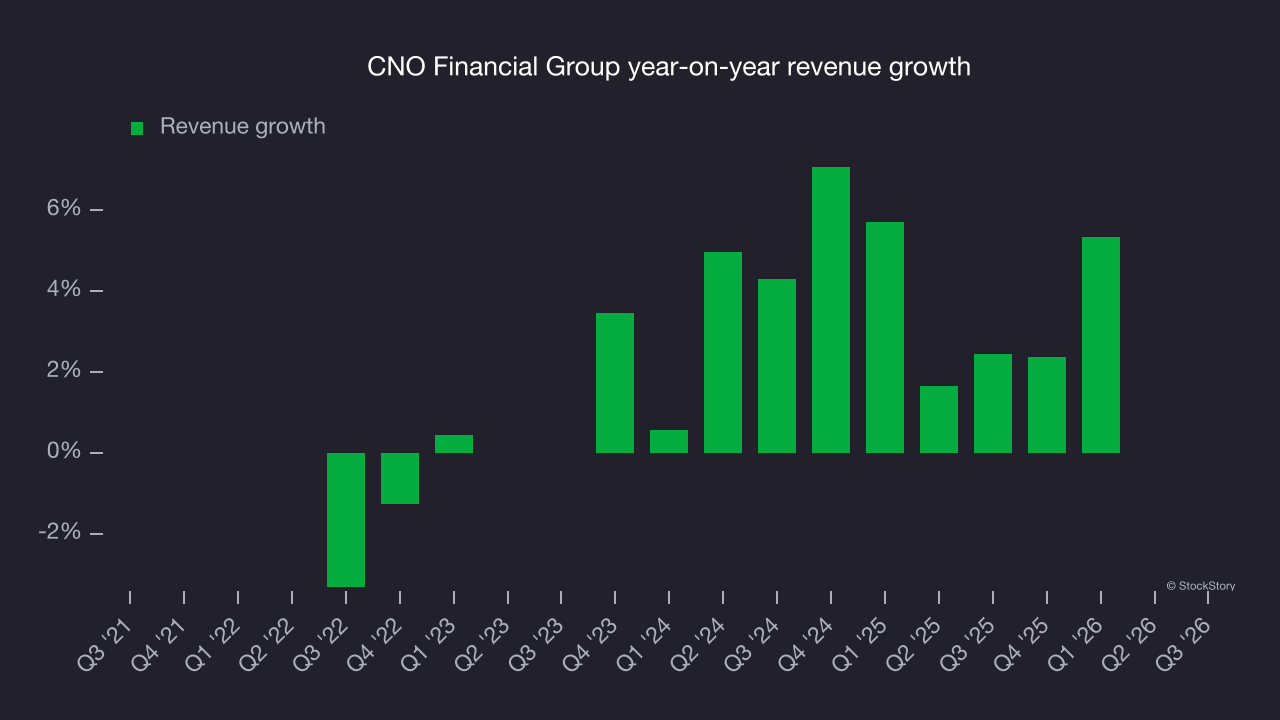
This quarter, CNO Financial Group reported year-on-year revenue growth of 12.6%, and its $1.09 billion of revenue exceeded Wall Street’s estimates by 7.7%.
Net premiums earned made up 68.5% of the company’s total revenue during the last five years, meaning insurance operations are CNO Financial Group’s largest source of revenue.
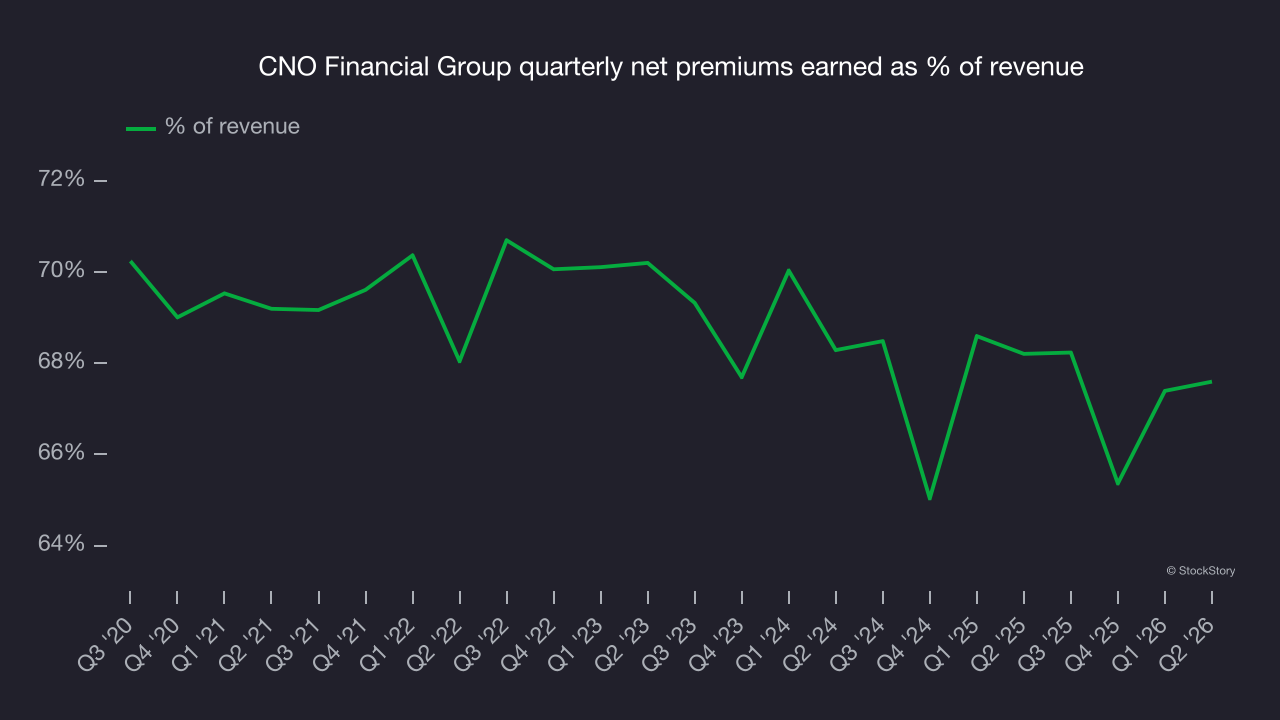
While insurers generate revenue from multiple sources, investors view net premiums earned as the cornerstone – their direct link to core operations stands in sharp contrast to the unpredictability of investment returns and fees.
Book value per share (BVPS)
Insurers are balance sheet businesses, collecting premiums upfront and paying out claims over time. Premiums collected but not yet paid out, often referred to as the float, are invested and create an asset base supported by a liability structure. Book value per share (BVPS) captures this dynamic by measuring these assets (investment portfolio, cash and reinsurance recoverables) less liabilities (claim reserves, debt and future policy benefits). BVPS is essentially the residual value for shareholders.
BVPS is therefore an important metric to track for insurers and sheds light on business quality. While other (and more commonly known) per-share metrics like EPS can sometimes be lumpy due to reserve releases or one-time items and can be managed or skewed while still following accounting rules, BVPS reflects long-term capital growth and is harder to manipulate.
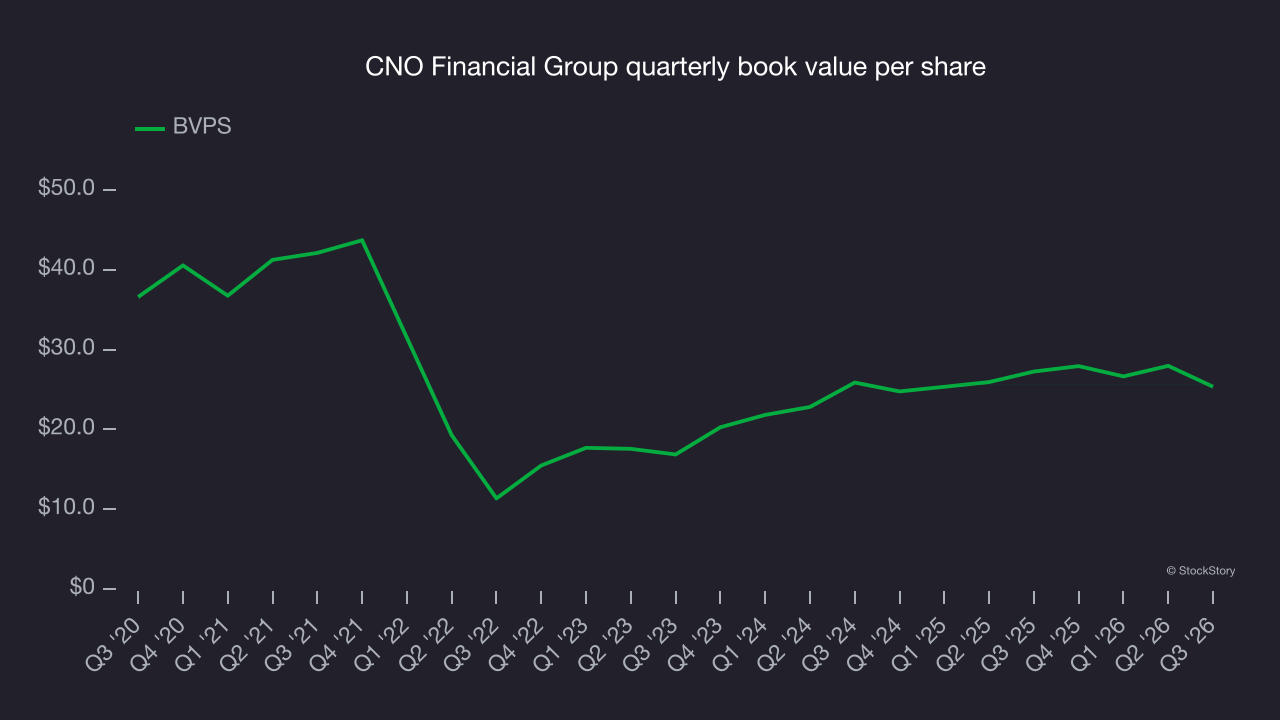
CNO Financial Group’s BVPS declined at a 9.7% annual rate over the last five years. On a two-year basis, BVPS fell at a slower pace, dropping by 1% annually from $25.86 to $25.34 per share.
Key takeaways from CNO Financial Group’s Q3 results
CNO Financial Group delivered a decent quarter, with revenue beating Wall Street’s consensus estimates by a wide margin and EPS also topping consensus. Book value per share, however, missed expectations. Shares rose 2% to $56.31 immediately after the results.
CNO Financial Group had a solid quarterly earnings result, but evaluating the stock requires more context. That decision should also account for valuation and business quality alongside the latest earnings. For more on those factors, read our full research report here (it’s free).