Stock market trends come in many forms, but this article will focus on the price trend. A trend is a general direction in which something develops; in the case of investing, the upward price trend is essential. Like they say, it pays to trade with your friend; the trend is your friend. This article looks at three stocks with impressive price trends set up for gains in the second half. Each fires a trend-following signal that investors can copy. The signals include price action, volume, moving averages, and technical indicators. Because fundamental factors support the price action and signals, they have a higher-than-average chance of paying off.
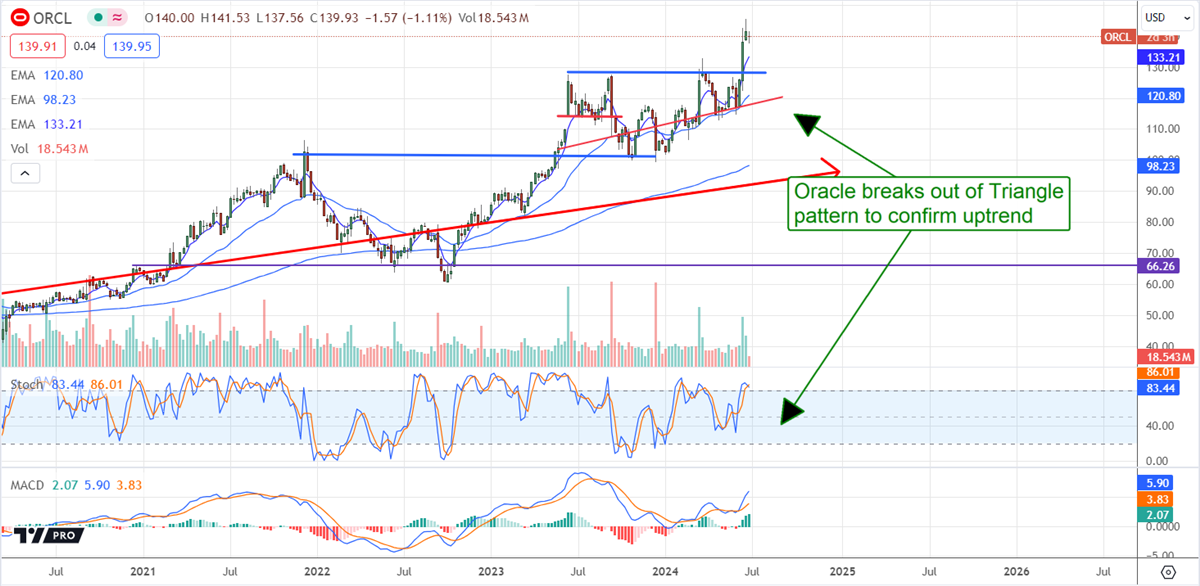
Oracle Breaks Out of a Triangle Pattern
Oracle’s (NYSE: ORCL) last earnings report confirmed its position as a primary player in the global AI infrastructure industry. That news helped the stock advance 10% in a week to break above its critical resistance point. That point was near $130; a move above it confirms upward momentum in the near-term rally and breaks the market out of a major consolidation. The consolidation manifested as a triangle pattern valued at $30 or 30% in magnitude, bringing a target of +$30 to +30% from the breakout point into play. Those projections range from $160 to $169, the low end of the range indicated by the charts.
The triangle pattern consolidated a larger rally that began last year. That rally is worth over $65, or about 100% of the 2023 low. Those projections bring targets of $195 to $260, a much more extensive range and well above the analysts' highest forecasts. However, the trend in analysts' sentiment is also upward and leading the market, with a consensus of $145 and a high end of $175. In this scenario, the market is well-supported with upward momentum that should continue to drive higher prices. As it is, the market is showing a small flag pattern that suggests $160 could be reached by summer.
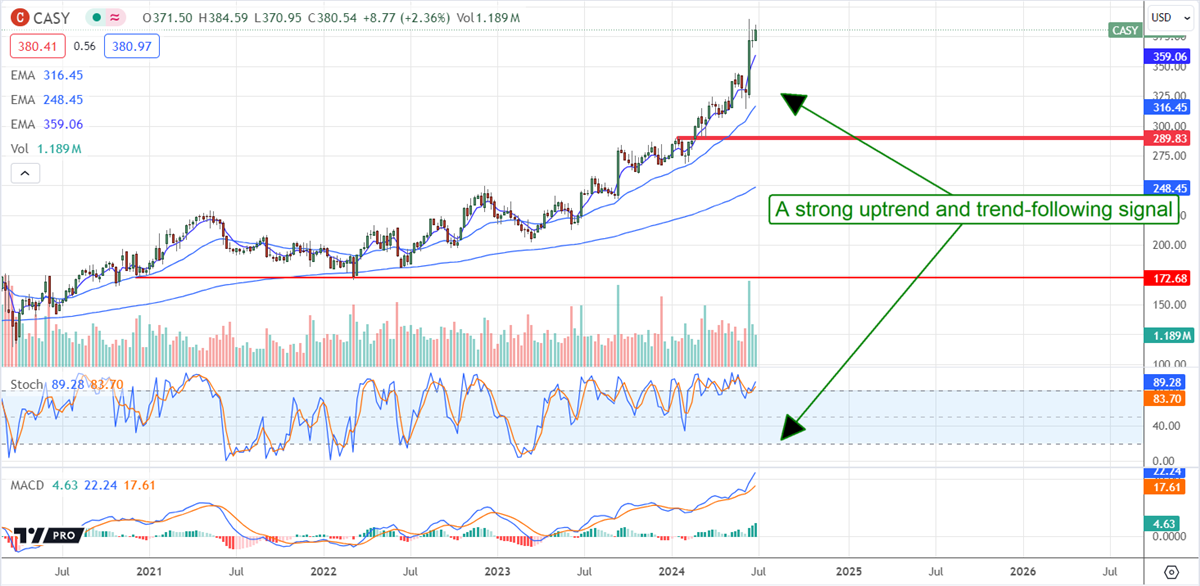
Casey’s General Stores Builds Momentum
Casey’s General Stores (NASDAQ: CASY) has been in rally mode for three years, driven by store count growth, market penetration, and margins. The company uses its cash wisely to maintain a fortress balance sheet, self-fund growth, pay dividends, and repurchase shares, driving share prices higher. The latest report triggered a significant trend-following signal, driving the market up by 20%, to confirm support at a cluster of moving averages.
Subsequent price action suggests a bullish flag pattern and a continuation signal is in play. The base-case scenario is for another $55 to 20% gain, which gives a target range of $435 to $456, which aligns with the high end of the analysts' target range.
The bull-case scenario is for this stock to continue rallying indefinitely, periodic corrections aside. The company is set up to increase its dividend annually at a double-digit CAGR without impairing its financial health, an outlook aided by share repurchases. The company’s repurchasing efforts reduced the count by an average of 0.8% for the last reported quarter, and the authorization in place is sufficient to do the same by next year.
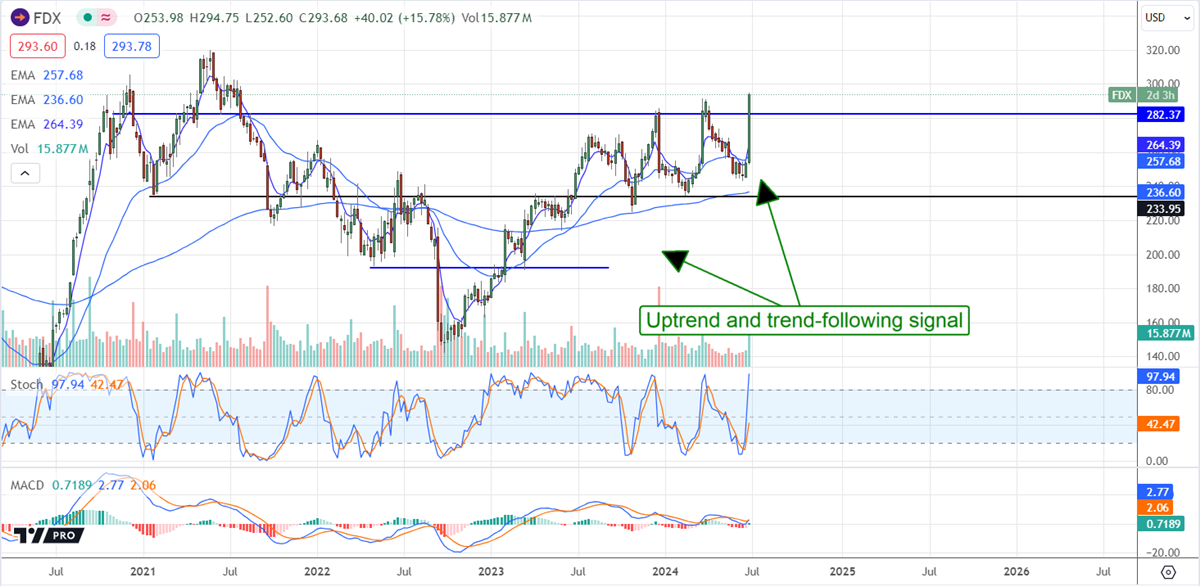
FedEx Delivers a Trend-Following Signal
FedEx’s (NYSE: FDX) FQ4 results were tepid, with growth below 1%, but the critical details were that it returned to growth, volume growth was positive in the core segment, margins widened, and the bottom line was strong. The company’s efforts are expected to sustain improvement through the year’s end, which will aid the balance sheet and capital return outlook. That includes dividends, dividend growth, and share repurchases.
The market surged 15% on the news to break above critical resistance. Critical resistance aligns with the top of a recent trading range and prior resistance levels that should now become support. The move confirms support at a cluster of moving averages and is MACD and stochastic compound the signal.
The MACD and stochastic are in the early phases of a strong entry signal that could increase the market by $50 or 21% from the $280 level. Those projections give targets of $330 to $336, aligning with the analysts' consensus estimate. Because the analysts are raising their targets and leading the market to the high end of their range, a move to the $340 to $360 range is expected.