As the second week of April 2026 begins, the S&P 500 Index (NYSE Arca: SPY) finds itself at a critical technical crossroads. After a volatile first quarter characterized by escalating military tensions in the Middle East and a renewed battle against inflation, the benchmark index is struggling to regain its footing. Despite a tentative "snap-back" rally in early April, the index remains pinned beneath its primary trend lines, signaling a period of deep uncertainty for institutional and retail investors alike.
The failure to reclaim key moving averages has shifted the market narrative from one of persistent growth to defensive positioning. With the index currently hovering around 6,582, market participants are closely monitoring whether this level represents a durable floor or merely a temporary pause before a deeper correction. As the Federal Reserve grapples with an energy-driven spike in consumer prices, the technical outlook suggests that broader market participation is desperately needed to overcome the current bearish momentum.
Technical Tensions: The S&P 500’s Battle with the Moving Averages
The technical health of the S&P 500 has deteriorated significantly over the past thirty days. Following the onset of major geopolitical conflict in late February, the index underwent a sharp distribution phase. This culminated in a "Death Cross" in late March, where the 50-day moving average of 6783.63 crossed below the 200-day moving average of 6644.6. As of today, April 7, 2026, the index continues to trade below both benchmarks, a setup that historically precedes prolonged periods of consolidation or downward pressure.
The Relative Strength Index (RSI) currently sits at 46.2%, reflecting a market that is neither oversold nor overbought. While this level is an improvement from the 30% "oversold" territory seen during the March lows, the lack of a strong bounce suggests a deficit of "buy-the-dip" conviction. Analysts note that the early April snap-back has so far lacked the volume necessary to pierce the 200-day resistance at 6644.6. A failure to move above this "red light" level by mid-month could trigger systematic selling from trend-following algorithms, potentially pushing the index toward psychological support at 6,500.
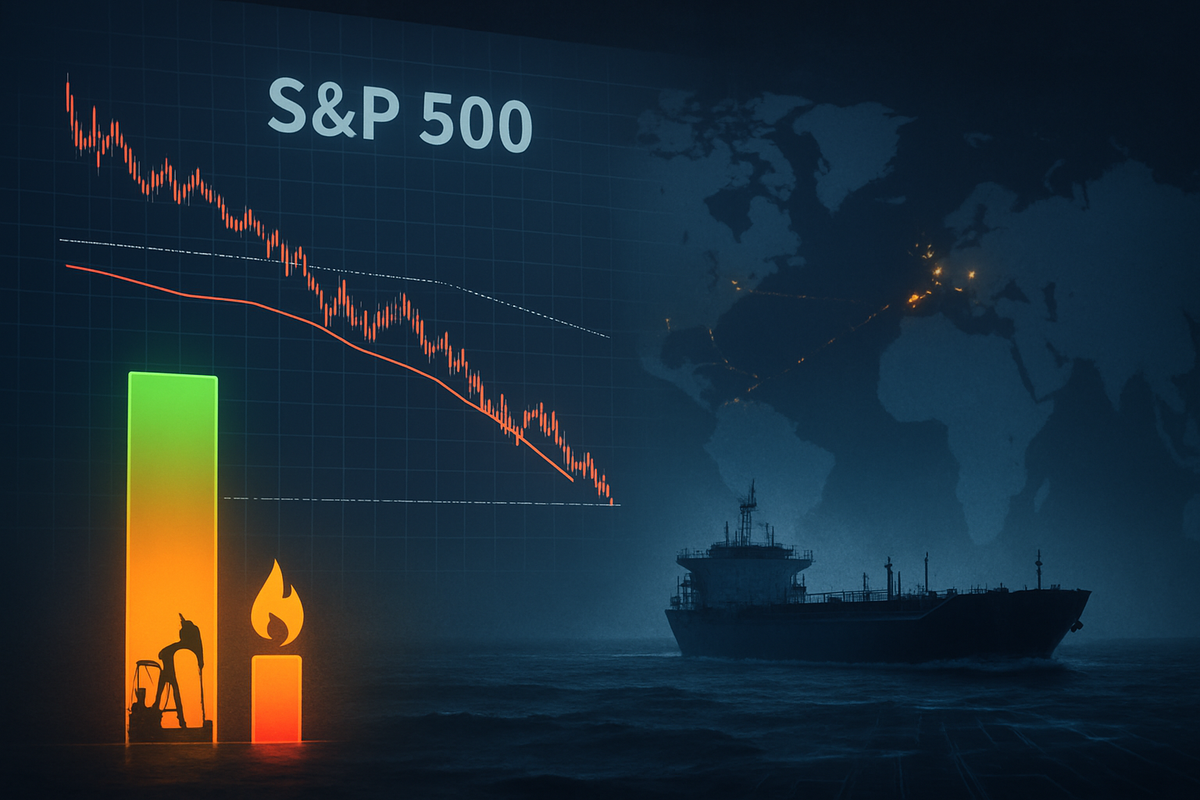
Market Divergence: Energy Giants Surge While Big Tech Stumbles
The current environment has created a stark divide between sectors, with energy companies emerging as the clear beneficiaries of global instability. Exxon Mobil Corporation (NYSE: XOM) and Chevron Corporation (NYSE: CVX) have led the charge, with the energy sector up over 34% in the first quarter of 2026. Exxon Mobil, in particular, has seen its stock price surge nearly 42% year-to-date as Brent crude prices spiked above $120 per barrel following disruptions in the Strait of Hormuz.
In contrast, the "Magnificent Seven" that led the markets in previous years are facing significant headwinds. Microsoft Corporation (NASDAQ: MSFT) has become a notable laggard, down approximately 23% year-to-date. Despite robust cloud revenue, investors have begun to penalize the software giant for massive capital expenditures in AI that have yet to translate into the high-margin returns expected in a high-interest-rate environment. Apple Inc. (NASDAQ: AAPL) has fared slightly better due to a successful "iPhone 17" cycle, but supply chain bottlenecks and geopolitical logistics have capped its gains, preventing the tech sector from providing its usual lift to the broader index.
Macroeconomic Headwinds: The Shadow of War and Inflation
The technical breakdown in the S&P 500 is inextricably linked to the geopolitical "black swan" events of early 2026. The initiation of "Operation Epic Fury" on February 28—a series of joint military strikes involving U.S. forces—has effectively reshaped the global energy map. The resulting closure of key maritime corridors has not only sent oil prices skyrocketing but has also reignited inflationary pressures that were thought to be contained in late 2025.
Recent CPI projections for 2026 have been revised upward, with annual inflation now expected to hover between 3.0% and 4.0%. This "sticky" inflation is derailing the Federal Reserve's previous plans for rate normalization, leading to fears of stagflation—a combination of stagnant growth and rising prices. This macro backdrop is remarkably similar to the energy shocks of the 1970s, prompting many institutional firms like JPMorgan Chase & Co. (NYSE: JPM) to slash their year-end price targets. The market is now pricing in a 50% probability of a formal recession by the end of the year, a sharp increase from the 25% probability estimated in January.
Looking Forward: The Path to Recovery or Recession
As we look toward the remainder of the second quarter, two primary scenarios are emerging. The bullish case, supported by firms like Deutsche Bank AG (NYSE: DB), suggests a "U-shaped recovery" where strong corporate earnings—projected to reach $309 per share for the S&P 500—eventually offset the geopolitical shocks. For this to manifest, the index must first reclaim the 200-day moving average and see a broadening of participation beyond just the energy and defensive sectors.
Conversely, the bearish scenario involves a "severe oil-shock" where a break below the 6,400 support level could trigger a retreat to 6,170, representing a major Fibonacci retracement. Strategists at The Goldman Sachs Group (NYSE: GS) have warned that if energy prices remain elevated above $150 for a sustained period, the S&P 500 could face a downside target as low as 5,400. Investors will be watching the upcoming earnings season with intense scrutiny, looking for signs that companies can maintain margins despite rising input costs and a cooling consumer base.
A Market at a Crossroads: Final Thoughts for Investors
The S&P 500’s current position below its 50-day and 200-day moving averages is more than just a technical glitch; it is a reflection of a world in transition. The transition from an era of cheap capital and global stability to one defined by geopolitical friction and persistent inflation has left the index without a clear driver of growth. While the early April snap-back provided some relief, it has yet to prove itself as a fundamental change in trend.
In the coming months, investors should keep a close eye on three key indicators: the resolution (or escalation) of Middle Eastern tensions, the stability of the 6,500 support level, and the ability of Big Tech to prove its AI-driven value proposition. Until the S&P 500 can decisively close above 6783.63, the 50-day moving average, the market remains in a "show-me" state, where caution and diversification into high-quality value and energy names appear to be the most prudent strategies.
This content is intended for informational purposes only and is not financial advice.