Aerospace and defense company Textron (NYSE: TXT) met Wall Street’s revenue expectations in Q2 CY2026, with sales up 3% year on year to $3.83 billion. Its non-GAAP profit of $1.62 per share was 4.8% above analysts’ consensus estimates.
Is now the time to buy Textron? Find out by accessing our full research report, it’s free.
Textron (TXT) Q2 CY2026 Highlights:
- Revenue: $3.83 billion vs analyst estimates of $3.81 billion (3% year-on-year growth, in line)
- Adjusted EPS: $1.62 vs analyst estimates of $1.55 (4.8% beat)
- Management reiterated its full-year Adjusted EPS guidance of $6.50 at the midpoint
- Operating Margin: 9.2%, in line with the same quarter last year
- Free Cash Flow Margin: 5.5%, down from 8.6% in the same quarter last year
- Market Capitalization: $16.72 billion
"The second quarter continued a strong start to the year for Textron with revenue growth in each of our manufacturing segments contributing to higher revenues of $500 million through the first half of the year,” said Textron CEO Lisa M. Atherton.
Company Overview
Listed on the NYSE in 1947, Textron (NYSE: TXT) provides products and services in the aerospace, defense, industrial, and finance sectors.
Revenue Growth
A company’s long-term sales performance is one signal of its overall quality. Any business can have short-term success, but a top-tier one grows for years. Regrettably, Textron’s sales grew at a sluggish 4.2% compounded annual growth rate over the last five years. This fell short of our benchmark for the industrials sector and is a poor baseline for our analysis.
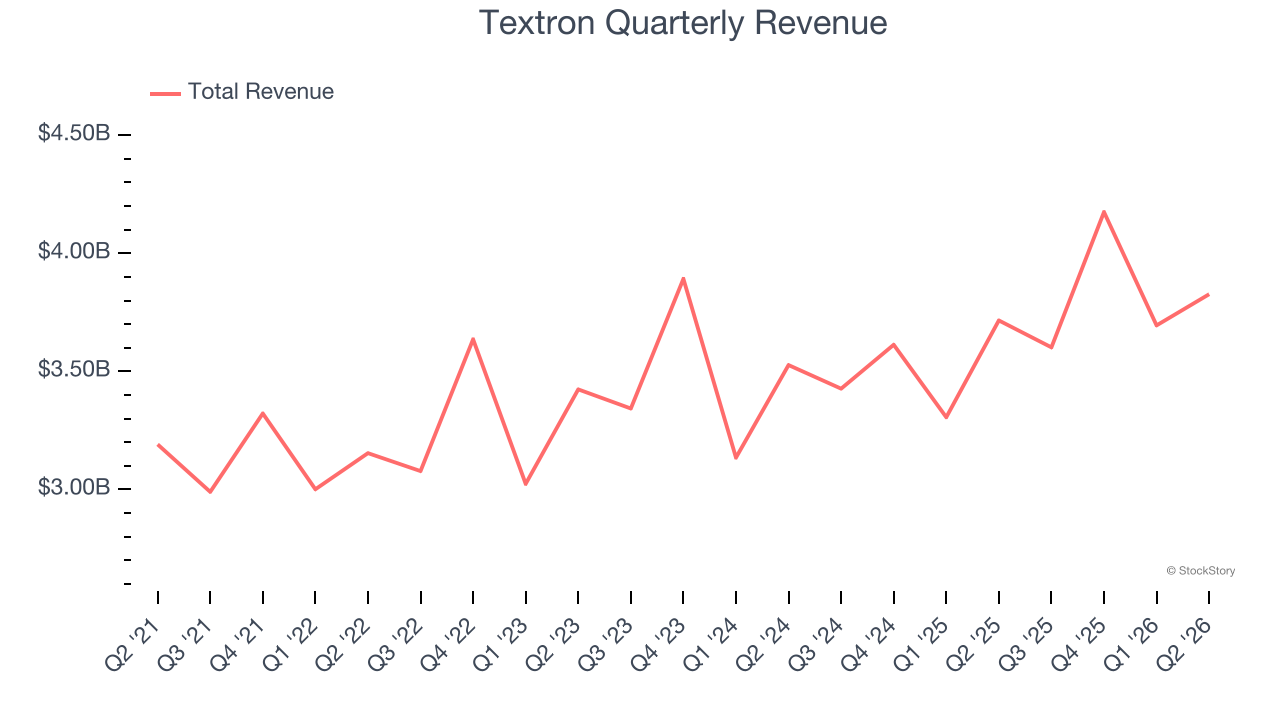
Long-term growth is the most important, but within industrials, a half-decade historical view may miss new industry trends or demand cycles. Textron’s annualized revenue growth of 4.9% over the last two years aligns with its five-year trend, suggesting its demand was consistently weak. 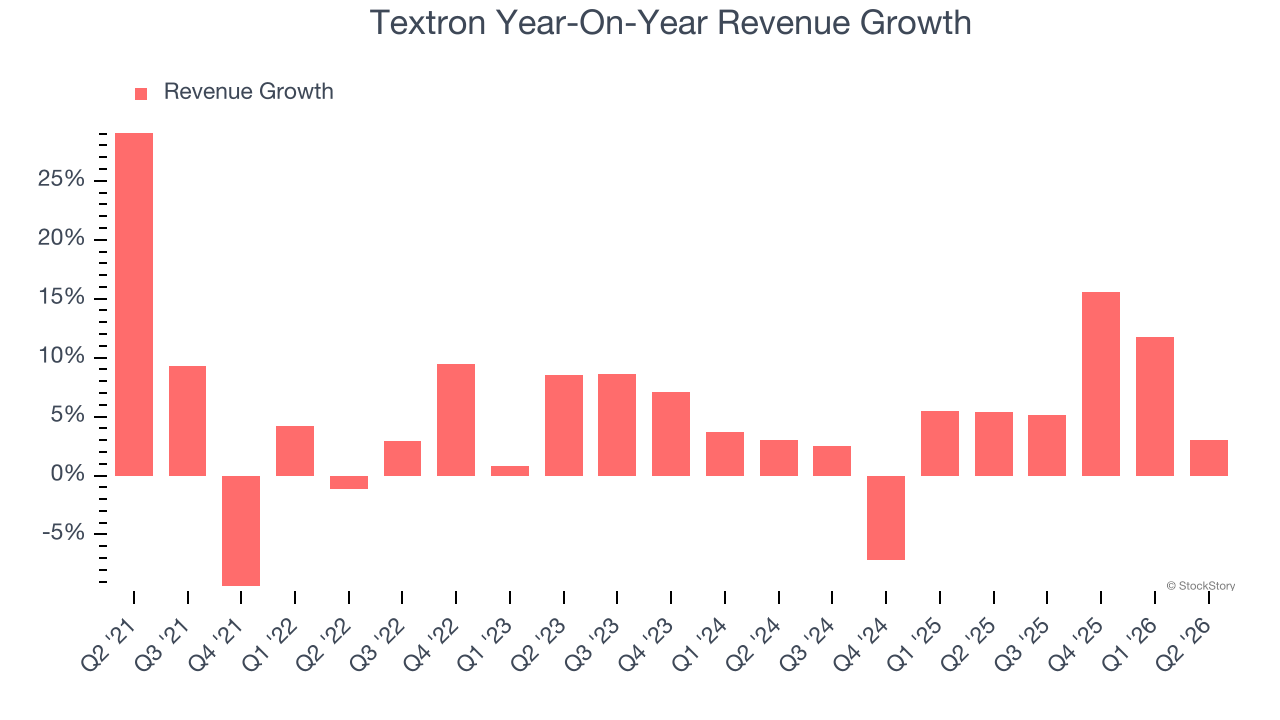
This quarter, Textron grew its revenue by 3% year on year, and its $3.83 billion of revenue was in line with Wall Street’s estimates.
Looking ahead, sell-side analysts expect revenue to grow 4.1% over the next 12 months, similar to its two-year rate. This projection is underwhelming and indicates its newer products and services will not lead to better top-line performance yet.
WHILE YOU’RE HERE: The Next Palantir? One satellite company captures images of every point on Earth. Every single day. The Pentagon wants it. Hedge funds are using it to beat earnings. You’ve probably never heard of it.
This is what the early days of Palantir looked like before it became a giant. Same playbook. Different technology. If you missed Palantir, you need to see this. Claim The Stock Ticker for Free HERE.
Operating Margin
Textron’s operating margin has more or less stayed the same over the last 12 months , averaging 8.5% over the last five years. This profitability was higher than the broader industrials sector, showing it did a decent job managing its expenses.
Looking at the trend in its profitability, Textron’s operating margin might have fluctuated slightly but has generally stayed the same over the last five years. This raises questions about the company’s expense base because its revenue growth should have given it leverage on its fixed costs, resulting in better economies of scale and profitability.
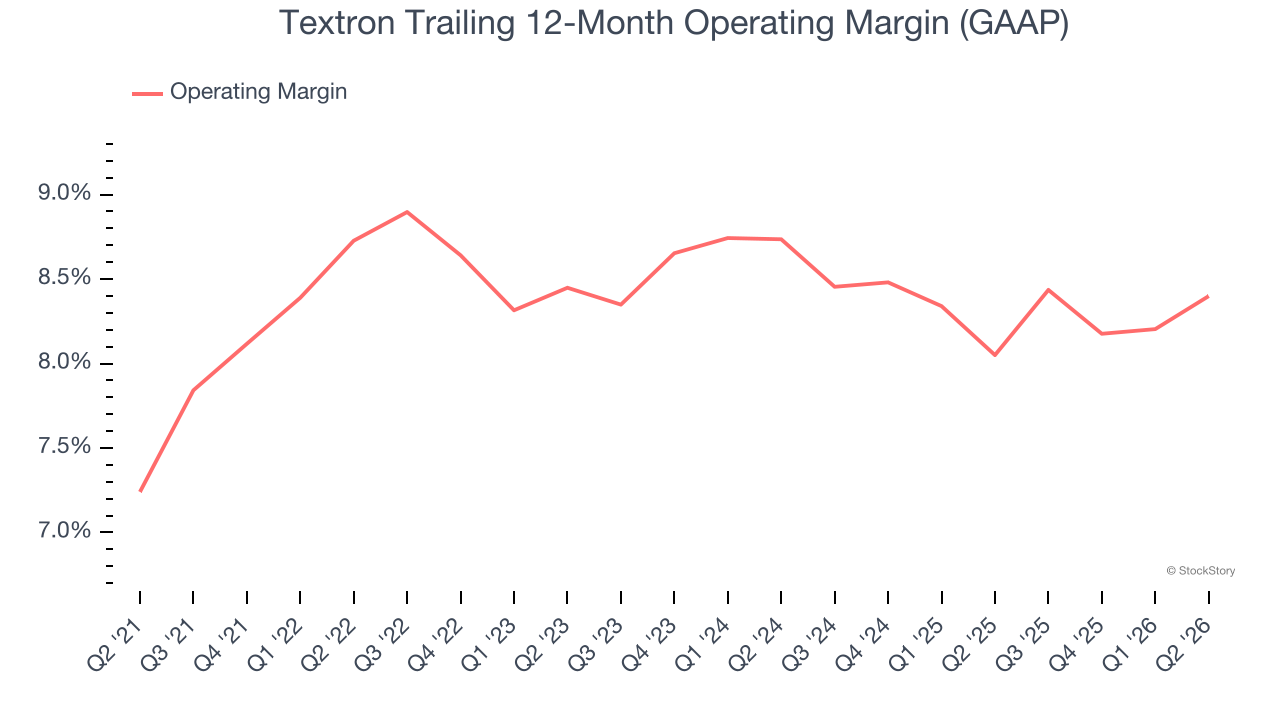
This quarter, Textron generated an operating margin profit margin of 9.2%, in line with the same quarter last year. This indicates the company’s overall cost structure has been relatively stable.
Earnings Per Share
We track the long-term change in earnings per share (EPS) for the same reason as long-term revenue growth. Compared to revenue, however, EPS highlights whether a company’s growth is profitable.
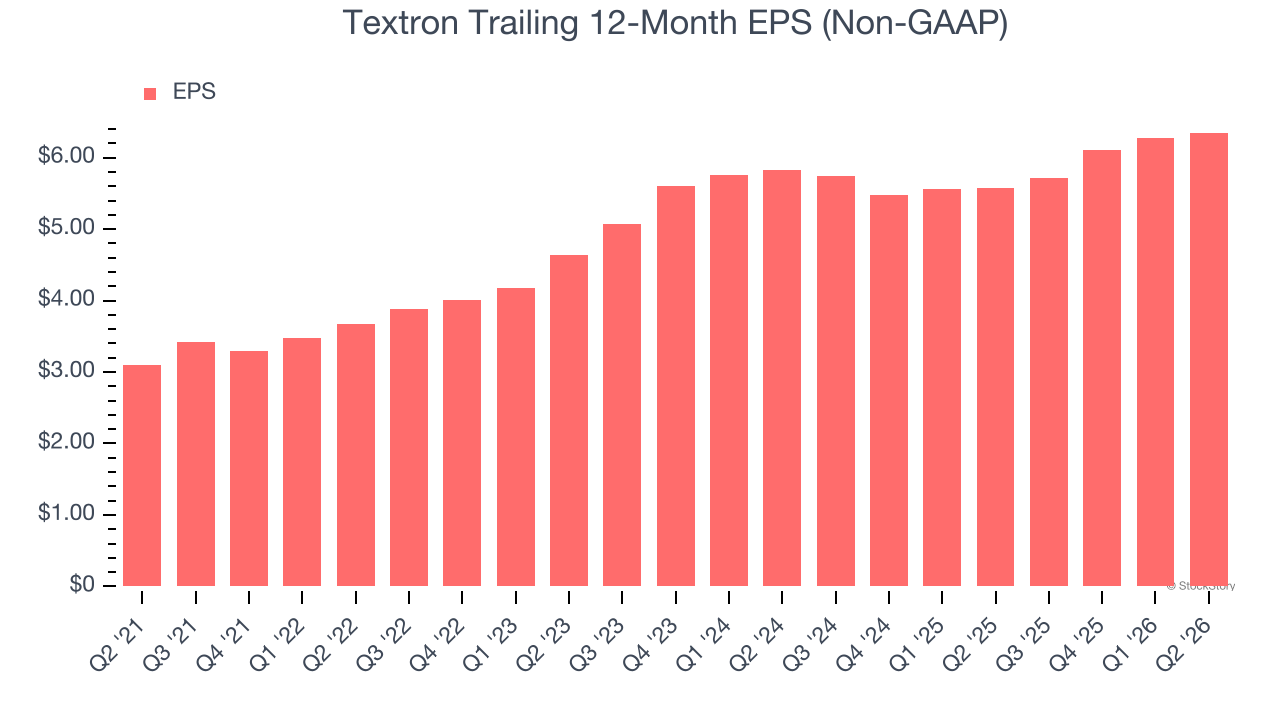
Textron’s EPS grew at 15.4% compounded annual growth rate over the last five years, higher than its 4.2% annualized revenue growth. This tells us the company became more profitable on a per-share basis as it expanded.
Diving into Textron’s quality of earnings can give us a better understanding of its performance. A five-year view shows that Textron has repurchased its stock, shrinking its share count by 23.4%. This tells us its EPS outperformed its revenue not because of increased operational efficiency but financial engineering, as buybacks boost per share earnings. 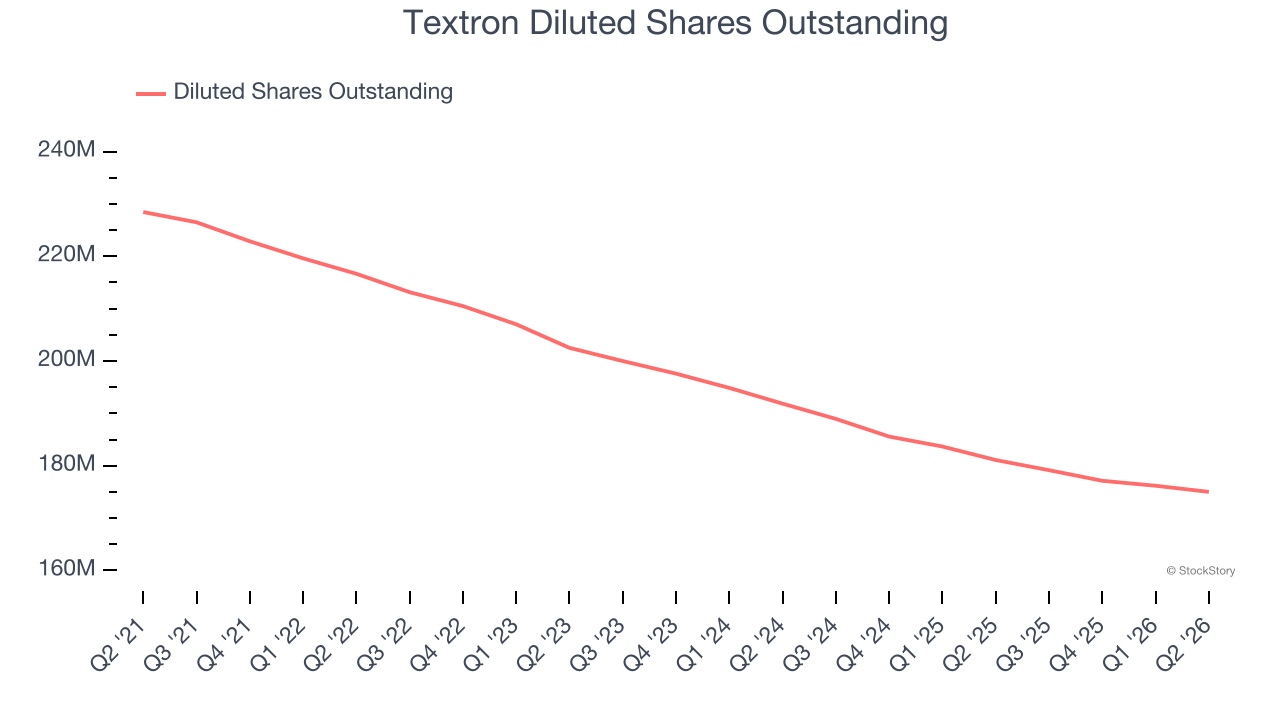
Like with revenue, we analyze EPS over a more recent period because it can provide insight into an emerging theme or development for the business.
For Textron, its two-year annual EPS growth of 4.4% was lower than its five-year trend. We hope its growth can accelerate in the future.
In Q2, Textron reported adjusted EPS of $1.62, up from $1.55 in the same quarter last year. This print beat analysts’ estimates by 4.8%. Over the next 12 months, Wall Street expects Textron’s full-year EPS to grow 6.6% from $6.35 to $6.77.
Key Takeaways from Textron’s Q2 Results
It was good to see Textron beat analysts’ EPS expectations this quarter. We were also happy its revenue was in line with Wall Street’s estimates. Zooming out, we think this was a decent quarter. Investors were likely hoping for more, and shares traded down 2.2% to $94.06 immediately following the results.
So do we think Textron is an attractive buy at the current price? When making that decision, it’s important to consider its valuation, business qualities, as well as what has happened in the latest quarter. We cover that in our actionable full research report which you can read here (it’s free).