The U.S. Treasury yield curve has contorted into a rare and unsettling U-shape, a configuration seen in only a fraction of the past five decades. This unusual curve, characterized by high short-term rates, a distinct dip in intermediate-term yields, and a subsequent rise for longer maturities, signals a profound standoff between the Federal Reserve's current monetary policy and the bond market's future expectations. This immediate implication is a market bracing for significant shifts, as investors grapple with the prospect of impending rate cuts amidst persistent long-term inflation and burgeoning fiscal deficits.
The U-Shape Unveiled: What Happened and Why It Matters
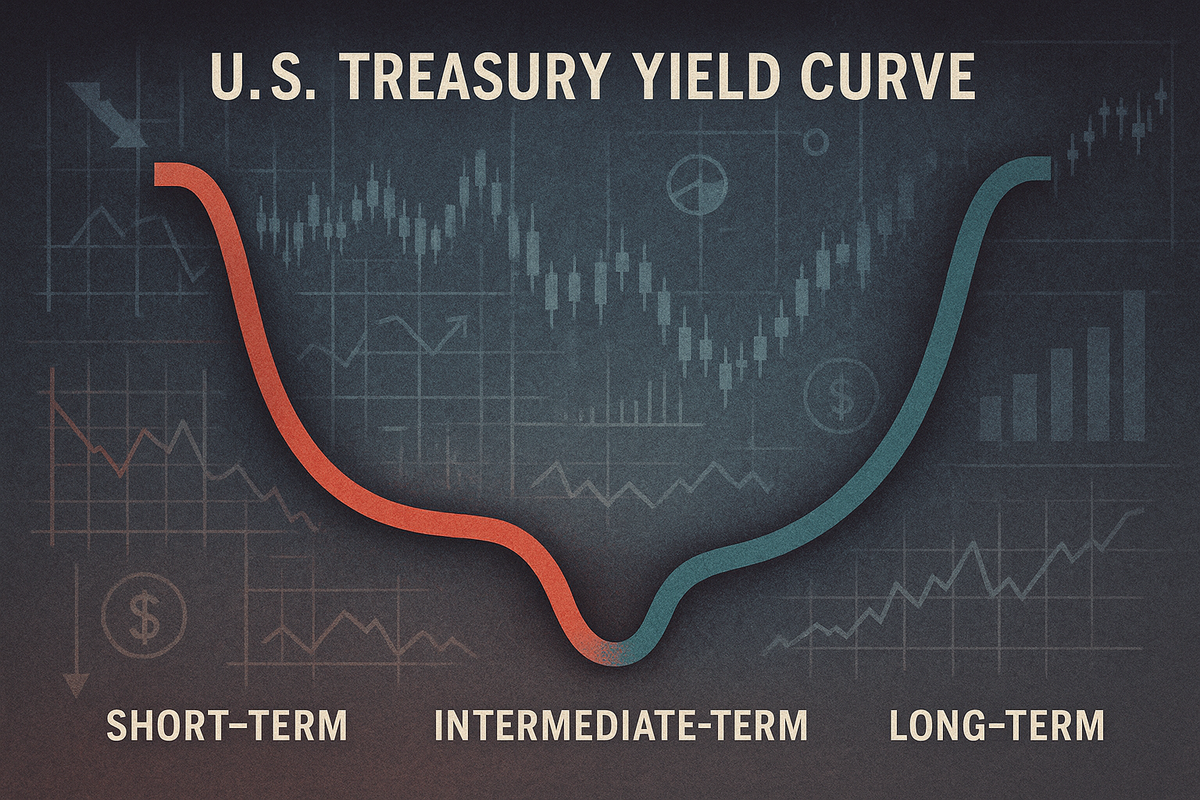
The current U-shaped U.S. Treasury yield curve, a phenomenon observed since late 2024 and becoming increasingly pronounced by August 2025, presents a unique economic puzzle. Unlike a "normal" upward-sloping curve or an "inverted" curve, the U-shape shows short-term rates (e.g., 1-month at 4.47%, 3-month at 4.33%) remaining elevated, followed by a noticeable decline in the "belly" of the curve (e.g., 1-year at 3.93%, 2-year at 3.756%), only to rise again significantly for longer durations (e.g., 10-year at 4.32-4.33%, 30-year at 4.918-4.92%).
This peculiar shape is a direct reflection of market participants' belief that current Federal Reserve interest rates are excessively high and unsustainable in the near term. The dip in intermediate yields strongly suggests an expectation of rapid Fed rate cuts in the coming one to three years, often interpreted as a pre-recessionary signal. This implies that the market is pricing in a potential economic slowdown or even a recession that would necessitate aggressive monetary easing. However, the subsequent rise in long-term rates indicates that while short-term rates are expected to fall, investors are demanding a higher premium for holding longer-duration debt. This premium is largely driven by ongoing concerns about the nation's rising fiscal deficits and the persistent threat of long-term inflation, suggesting that even after potential near-term rate cuts, the overall cost of capital may remain elevated due to structural economic pressures. The timeline of events leading to this moment includes a period of aggressive Fed rate hikes to combat inflation, followed by a gradual realization in the market that these rates might be too restrictive, leading to the current "standoff" where the market anticipates a pivot that the Fed has yet to explicitly signal. Key players involved are, of course, the Federal Reserve, the U.S. Treasury, and major institutional investors who are actively shaping the yield curve through their buying and selling activities. Initial market reactions have included increased volatility and a re-evaluation of investment strategies across various asset classes.
Navigating the U: Winners and Losers in a Shifting Landscape
The U-shaped yield curve, coupled with the anticipation of Fed rate cuts and persistent elevated long rates, creates a complex financial environment with clear winners and losers across various sectors.
Potential Winners:
The real estate and homebuilding sectors are poised to benefit significantly. Lower short-term interest rates, a direct consequence of anticipated Fed cuts, translate into more affordable mortgage rates. This can stimulate housing demand, boosting homebuilders like Lennar Corporation (NYSE: LEN) and D.R. Horton, Inc. (NYSE: DHI), as well as companies involved in building products. Real Estate Investment Trusts (REITs) may also see gains as their borrowing costs decrease.
Consumer discretionary companies are also likely to experience a boost. As short-term rates fall, consumers face reduced interest payments on credit cards and auto loans, freeing up disposable income. This can lead to increased spending on big-ticket items and improved consumer confidence, benefiting retailers and leisure companies.
Utilities, known for their stable and often high dividend yields, become more attractive to conservative investors when short-term bond yields decline. Companies like NextEra Energy, Inc. (NYSE: NEE) can also benefit from reduced borrowing costs for their extensive infrastructure projects.
Defensive sectors such as healthcare and consumer staples tend to outperform in periods following initial Fed rate cuts, especially if the economy achieves a "soft landing." Companies like Johnson & Johnson (NYSE: JNJ) and Procter & Gamble Co. (NYSE: PG) could see stable demand and benefit from improved household spending power.
Companies with strong balance sheets and low reliance on long-term debt are well-positioned to navigate this environment. They can capitalize on lower short-term financing costs for working capital or short-term projects. Furthermore, the "belly" of the U-shaped curve presents a unique opportunity for corporate debt issuers. Companies might strategically extend their borrowing maturity to the one-to-two-year tenor, where rates are lowest, to reduce their overall cost of capital compared to very short-term floating rates.
Potential Losers:
The financial sector, particularly banks, faces a mixed and complex outlook. While a steepening yield curve (where long rates are higher than short rates) can generally benefit banks by widening their net interest margins, the specific U-shape with falling short-term rates could compress these margins if the cost of deposits does not fall as quickly as lending rates. Lower rates can also lead to reduced loan demand and potentially increased loan defaults if the rate cuts are a response to economic weakness. Major banks like JPMorgan Chase & Co. (NYSE: JPM) and Bank of America Corporation (NYSE: BAC) will need to carefully manage their balance sheets.
Capital-intensive industries, including manufacturing, construction, and some industrials, are likely to face headwinds. Elevated long-term interest rates significantly increase the cost of financing large-scale, long-term investments such as new plants and equipment. This can hinder expansion plans, reduce capital expenditures, and negatively impact profitability for companies like Caterpillar Inc. (NYSE: CAT) and General Electric Company (NYSE: GE).
Growth stocks, often characterized by high valuations based on future expected cash flows, are particularly vulnerable. Elevated long-term interest rates increase the discount rate used to value these future cash flows, leading to a reduction in their present valuation. Historically, the technology sector, home to many growth stocks like NVIDIA Corporation (NASDAQ: NVDA) and Tesla, Inc. (NASDAQ: TSLA), has underperformed the S&P 500 in the six months following the first Fed rate cut.
Companies with a substantial amount of existing variable-rate long-term debt could continue to face high borrowing costs, impacting their cash flow and profitability, even as short-term rates decline. Finally, savers, including individuals and businesses holding cash or investing in very short-term instruments like savings accounts and Certificates of Deposit (CDs), will likely experience reduced returns as the Fed cuts short-term rates.
Broader Implications: A Historical Echo of Economic Crossroads
The U-shaped U.S. Treasury yield curve is more than just a technical anomaly; it's a potent signal of broader economic shifts and potential disruptions. Its rarity, occurring in only about 3% of the time over the past five decades, underscores its significance as a harbinger of change.
This unusual curve fits into broader industry trends by highlighting the increasing cost of capital across the economy. For the banking sector, a U-shaped curve, with its high short-term rates and a dip in intermediate maturities, can compress net interest margins (NIMs), impacting profitability for institutions like Wells Fargo & Company (NYSE: WFC). While some banks may employ hedging strategies, the overall environment presents challenges. In real estate, higher interest rates generally increase financing costs, potentially slowing down transactions and development. Corporate borrowing also faces unique challenges; while floating-rate borrowing is expensive, the dip in the intermediate part of the curve might offer a strategic opportunity for companies to extend maturities at potentially lower costs. However, overall increased borrowing costs can act as a brake on capital-intensive sectors like manufacturing and infrastructure, leading to higher operational expenses and slower growth.
The ripple effects of a U-shaped curve are far-reaching. Historically, nearly every U-shaped yield curve has immediately preceded an economic recession, making it a strong, albeit rare, indicator of significant economic changes ahead. This implies that the market is factoring in recessionary concerns, which could dampen consumer spending and business investment due to increased borrowing costs and a tightening of liquidity. Furthermore, the elevated long rates, despite the anticipated near-term rate cuts, suggest that investors remain concerned about persistent long-term inflation and rising fiscal deficits. This indicates a market balancing near-term economic weakness with longer-term uncertainty regarding inflation persistence. Globally, rising U.S. yields can trigger ripple effects across international bond markets, influencing currency valuations and trade competitiveness.
From a regulatory and policy perspective, the U-shaped curve highlights a "standoff" between the Federal Reserve's current monetary policy and market expectations. The market believes current Fed rates are too high compared to what is expected in the next two to three years, implying a divergence between the Fed's stated intentions (e.g., maintaining tight policy to combat inflation) and the market's anticipation of future rate cuts due to expected economic weakness. The resolution of this "standoff" is crucial; it could lead to the Fed significantly reducing short-term rates, or if the Fed holds its ground, long-term interest rates might surge as the market demands more compensation for longer-term risk.
Historical precedents underscore the gravity of the current situation. U-shaped curves preceded the Asian and Russian Financial Crises in 1998, the Dot-com bubble crash in 2000, and the Great Financial Crisis (GFC) in 2007. More recently, a U-shape emerged just before the COVID-19 pandemic in late 2019. These historical periods typically lasted around 16 weeks on average and were resolved by a significant and often rapid reduction in short-term policy rates by the Federal Reserve. This consistent pattern reinforces the U-shaped curve as a strong indication of impending significant changes in the economy and interest rates, often signaling a near-term recession followed by an anticipated longer-term recovery.
What Comes Next: Navigating the Economic Crossroads
The U-shaped U.S. Treasury yield curve signals a period of significant transition and uncertainty for the financial markets and the broader economy. The immediate future (2025-2026) is likely to be characterized by a continued deceleration in real GDP growth, with forecasts suggesting a slowdown to around 1.4%-1.5%. The labor market is anticipated to soften, with the unemployment rate gradually rising towards 4.6%-4.9% by early to mid-2026. Inflation remains a key concern, with expectations for it to pick up due to tariff-induced cost pressures, potentially averaging around 2.9% in 2025 and accelerating to 3.2% in 2026.
In the short term, the yield curve is widely expected to steepen. This steepening will be driven by anticipated Federal Reserve rate cuts, which will push down shorter-dated yields, and a surge in Treasury issuance to fund growing budget deficits, coupled with re-emerging inflation expectations, which will exert upward pressure on longer-term yields. The 10-year Treasury yield is projected to hover near 4.5% for the remainder of 2025, with some risk of moving to 5%, before potentially declining slowly in 2026.
Looking further out (beyond 2026), real GDP growth is expected to moderate further, settling into a steady-state growth rate of about 1.8% by 2029, with inflation moderating to around 2.3%. However, long-term Treasury yields may remain elevated relative to historical averages due to persistent policy uncertainty around inflation and the continued increase in Treasury issuance to fund deficits. The long-term trajectory of public debt, projected to approach 100% of GDP by the end of the decade, poses a significant challenge and could keep borrowing costs higher.
Strategic pivots are anticipated from both monetary and fiscal policy. The Federal Reserve is at a pivotal inflection point, with a growing consensus for rate cuts in 2025, potentially starting as early as September. The Fed's dual mandate is increasingly tilting towards supporting employment amidst a softening labor market, even as inflation remains above its 2% target. Analysts anticipate one to two rate cuts in the second half of 2025, with some projecting a total of 2 percentage points in cuts through the end of 2027. On the fiscal front, the U.S. faces significant challenges with rising federal budget deficits. The extension of key provisions of the 2017 Tax Cuts and Jobs Act (TCJA) is expected to avert a fiscal cliff but could exacerbate debt sustainability concerns, potentially leading to upward pressure on interest rates.
Market opportunities will emerge from these shifts. As the yield curve steepens, opportunities arise for "steepening curve trades," such as going long on 10-year Treasuries and short on 2-year Treasuries. With anticipated Fed rate cuts, investors may find opportunities in reallocating towards long-duration bonds and high-quality, intermediate- to long-term municipal bonds. Short-duration bonds (e.g., 2-5 year Treasuries) are also likely to outperform in a rate-cutting environment. Rate-sensitive sectors like utilities and consumer discretionary could benefit from lower interest rates. Treasury Inflation-Protected Securities (TIPS) can be a strategic allocation for hedging against potential tariff-related inflation.
Several potential scenarios could unfold. A "baseline/soft landing" scenario involves a gradual deceleration of economic growth and inflation moderating, allowing for measured rate cuts. A "mild recession" scenario, with a notable probability, could be triggered by the cumulative effect of higher tariff costs and elevated interest rates, leading to accelerated Fed rate cuts. Conversely, an "economic outperformance/higher inflation" scenario could be driven by aggressive expansionary fiscal policies or sustained productivity growth, potentially pushing inflation higher and causing the Fed to pause or reverse its rate-cutting trajectory. Finally, a "stagflation" scenario, where both inflation and unemployment rise quickly, would leave the Federal Reserve in a difficult position, with highly uncertain yield curve behavior.
Conclusion: A Market in Flux, Investors on Alert
The U-shaped U.S. Treasury yield curve is a powerful and rare signal, summarizing a complex interplay of economic forces and policy expectations. Its current configuration highlights a critical standoff between the Federal Reserve's existing high interest rates and the bond market's firm belief in impending rate cuts, driven by concerns of a near-term economic slowdown or recession. Simultaneously, the elevated long-term rates underscore persistent anxieties about rising fiscal deficits and the enduring threat of long-term inflation, creating a challenging environment for both borrowers and investors.
Moving forward, the market is poised for significant adjustments. The historical precedent of U-shaped curves preceding economic disruptions suggests that a decisive resolution, likely involving substantial Fed rate cuts, is on the horizon. This will undoubtedly reshape borrowing costs, investment strategies, and corporate profitability across various sectors. While some industries, such as real estate and consumer discretionary, may find tailwinds from lower short-term rates, others, particularly capital-intensive sectors and growth stocks, will face headwinds from elevated long-term borrowing costs and higher discount rates.
Investors should remain highly vigilant in the coming months. Key takeaways include the strong signal of a potential economic deceleration, the anticipated shift in Fed policy, and the enduring impact of fiscal pressures on long-term rates. Monitoring the Federal Reserve's communications, particularly around the upcoming Jackson Hole symposium, will be crucial for understanding the pace and magnitude of potential rate cuts. Furthermore, tracking inflation data, government spending, and corporate earnings will provide vital insights into the economy's trajectory and the performance of different sectors. Active portfolio rebalancing, with a focus on quality assets and strategic allocations to benefit from yield curve steepening or long-duration opportunities, will be paramount for navigating this dynamic and uncertain financial landscape. The "Unsettling U" serves as a stark reminder that the market is in flux, demanding careful consideration and agile adaptation from all participants.